1. Market Structure Overview
ETH is currently trading between two important HTF zones:
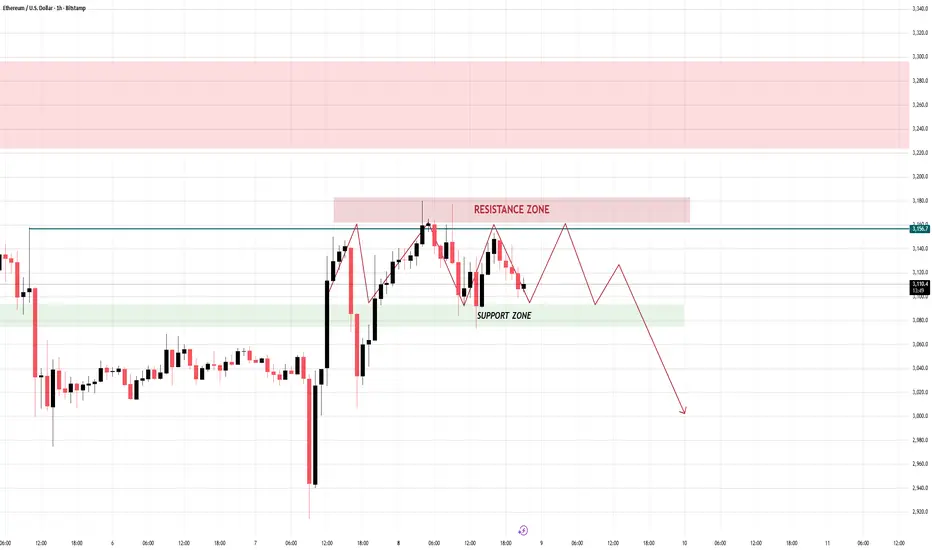
- Resistance Zone: 3150 – 3180
- Support Zone: 3050 – 3080
Price recently created a lower high rejection inside the resistance zone and is now pulling back toward support, signaling early weakness.
The overall structure shows:
- Short-term bullish push, but failing to break resistance
- Formation of LH → LL → LH, indicating bearish momentum emerging
- Market is compressing, preparing for a larger directional move
This aligns with the transition phase where liquidity is being collected before a breakout — typically to the downside.
2. Technical Analysis
Here’s what the chart reveals:
A. Resistance Rejection
Price tapped directly into the 3150–3180 resistance zone, leaving a long wick followed by impulsive selling.
→ This confirms strong sell-side presence.
B. Weak Bullish Recovery
The bounce from support lacks strength:
- Candles are smaller
- Momentum slowing
- Lower highs forming
This reflects a market losing bullish pressure.
C. Bearish Structure Development
The zig-zag projection shown matches current behavior:
- Price likely retests 3150
- Forms another Lower High
- Then breaks down sharply toward deeper support
D. Liquidity Map
- Liquidity sits below 3050
- Market is likely to sweep this level before strong buyers step in
→ Expect a liquidity grab before any major reversal.
3. Trading Plan (Entry – SL – TP)
🎯 SELL Setup (High-Probability)
Entry: 3145 – 3160
Stop Loss: 3188
Take Profit 1: 3080
Take Profit 2: 3020
Final Target: 2980
Reason:
Price is forming clean LH structure at resistance + bearish rejection → ideal position for swing short.
⚠️ Alternate Scenario (If invalidation occurs)
If price closes above 3190 on H1 → bearish idea invalid.
→ Stay out and wait for a bullish retest to re-enter long.
4. Summary
ETH is showing strong signs of distribution at resistance. The market is forming Lower Highs and preparing for a deeper decline toward the 2980 zone. The most optimal play is a sell entry at the resistance rejection, with tight SL and clear profit targets.
ETH is currently trading between two important HTF zones:
- Resistance Zone: 3150 – 3180
- Support Zone: 3050 – 3080
Price recently created a lower high rejection inside the resistance zone and is now pulling back toward support, signaling early weakness.
The overall structure shows:
- Short-term bullish push, but failing to break resistance
- Formation of LH → LL → LH, indicating bearish momentum emerging
- Market is compressing, preparing for a larger directional move
This aligns with the transition phase where liquidity is being collected before a breakout — typically to the downside.
2. Technical Analysis
Here’s what the chart reveals:
A. Resistance Rejection
Price tapped directly into the 3150–3180 resistance zone, leaving a long wick followed by impulsive selling.
→ This confirms strong sell-side presence.
B. Weak Bullish Recovery
The bounce from support lacks strength:
- Candles are smaller
- Momentum slowing
- Lower highs forming
This reflects a market losing bullish pressure.
C. Bearish Structure Development
The zig-zag projection shown matches current behavior:
- Price likely retests 3150
- Forms another Lower High
- Then breaks down sharply toward deeper support
D. Liquidity Map
- Liquidity sits below 3050
- Market is likely to sweep this level before strong buyers step in
→ Expect a liquidity grab before any major reversal.
3. Trading Plan (Entry – SL – TP)
🎯 SELL Setup (High-Probability)
Entry: 3145 – 3160
Stop Loss: 3188
Take Profit 1: 3080
Take Profit 2: 3020
Final Target: 2980
Reason:
Price is forming clean LH structure at resistance + bearish rejection → ideal position for swing short.
⚠️ Alternate Scenario (If invalidation occurs)
If price closes above 3190 on H1 → bearish idea invalid.
→ Stay out and wait for a bullish retest to re-enter long.
4. Summary
ETH is showing strong signs of distribution at resistance. The market is forming Lower Highs and preparing for a deeper decline toward the 2980 zone. The most optimal play is a sell entry at the resistance rejection, with tight SL and clear profit targets.
Trade active
🔶 ETH Bullish Outlook — Market Structure + Strong Macro Support
Ethereum continues to show a constructive bullish structure, and the current market conditions are providing solid justification for further upside. Price action is holding firmly above key support zones, with momentum gradually shifting in favor of buyers a sign that the next expansion phase may be forming.
📈 1. Risk-On Sentiment Returning
Global markets are shifting back toward a risk-on environment, as investors anticipate:
Lower interest rates from major central banks
Easing inflation pressures
Stronger appetite for high-growth assets
Crypto — especially ETH — typically benefits first when risk appetite improves.
📉 2. Fed Policies Support Higher Liquidity
Recent signals from the Federal Reserve suggesting potential rate cuts and slower tightening are boosting liquidity across markets.
More liquidity → more demand for crypto → supportive conditions for ETH to continue climbing.
🌐 3. Growing Institutional Exposure to ETH
Capital inflows from institutional investors into Ethereum-based products, staking platforms, and L2 ecosystems show rising confidence in ETH’s long-term value.
This creates strong underlying demand, helping price maintain bullish momentum.
⚙️ 4. Ethereum Network Fundamentals Are Strengthening
Key technical drivers include:
Increasing staking participation
Expanding L2 activity
Network efficiency improvements
Rising adoption of smart contract platforms
These fundamentals create real, organic demand — supporting a sustained uptrend.
💡 5. Market Structure Favors Upside
ETH remains in a clean higher-low / higher-high structure, with price compressing toward a breakout zone.
Sideways accumulation at support is often a precursor to a strong impulsive move upward.
🔺 Bottom Line
All major pillars price structure, macro sentiment, liquidity conditions, and network fundamentals are aligning to support a continued bullish trajectory for ETH.
If current support levels hold, Ethereum is well-positioned for the next breakout and a push toward higher targets.
MY COMMUNITY GROUP GET FREE SIGNAL
✅ 100% Free — I don’t take a penny from anyone
✅ Free Signal: 4 - 6 signals
✅ Trading Idea / Setup / Technical
✅ JOIN MY COMMUNITY GROUP IN Telegram:
t.me/+vxDQ4bhDfsw3MGU1
✅ 100% Free — I don’t take a penny from anyone
✅ Free Signal: 4 - 6 signals
✅ Trading Idea / Setup / Technical
✅ JOIN MY COMMUNITY GROUP IN Telegram:
t.me/+vxDQ4bhDfsw3MGU1
Related publications
Disclaimer
The information and publications are not meant to be, and do not constitute, financial, investment, trading, or other types of advice or recommendations supplied or endorsed by TradingView. Read more in the Terms of Use.