ETHEREUM 1D MARKET ANALYSIS
1. Current Price Structure
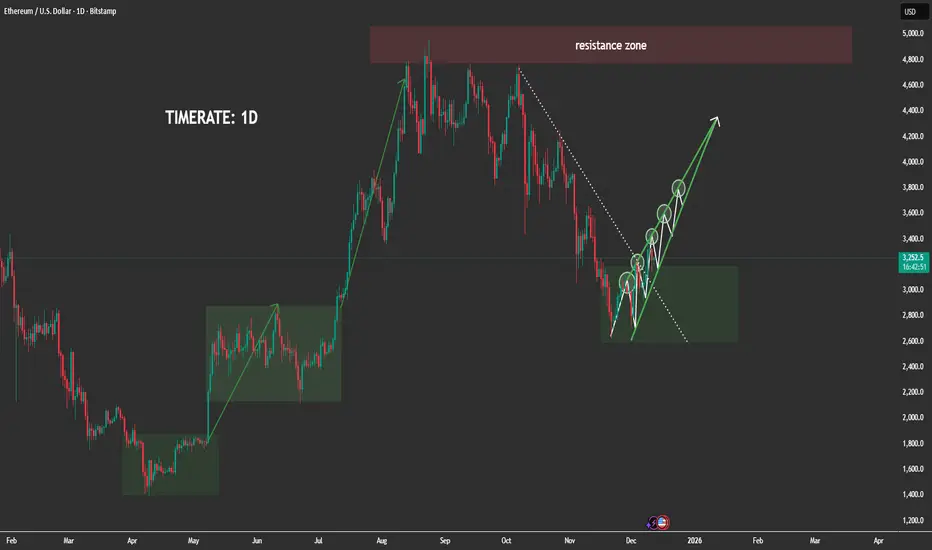
- ETH previously completed a strong bullish impulsive wave, breaking through multiple resistance levels before reaching the major 4,800–5,000 resistance zone, where the market formed a clear distribution top.
-After distribution, price entered a large corrective decline, following the descending dotted trendline visible on your chart.
-Recently, ETH has formed a broad accumulation block (highlighted in green), similar to the previous accumulation phases that triggered massive ETH rallies earlier in the year.
Inside this zone, ETH is now building a series of higher lows, showing early signs of bullish reconstruction.
-The current rising green structure indicates that price is forming a stair-step bullish pattern, preparing for a potential macro reversal.
2. Key Liquidity Zones
-Major Resistance Zone: 4,800–5,000
-This is the next major destination if ETH successfully completes the accumulation and transitions into expansion.
-Accumulation Block: 2,750–3,150
-This is where smart money is currently active — sweeping liquidity, trapping sellers, and accumulating long positions.
-Multiple liquidity grabs have already occurred inside this range, confirming strong institutional absorption.
-The current structure closely mirrors previous accumulation rectangles on the chart that led to massive bullish expansions.
3. Today's Market Scenario (1D Outlook)
Matches perfectly with the upward projection on your chart.
🔹 Main Scenario – Bullish Continuation After Accumulation
ETH is likely to follow this sequence:
-Continue building higher lows inside the accumulation block.
-Retest the inner structure trendline without breaking the macro zone.
-Form a clean break above the descending dotted trendline — signaling a bullish structure shift.
-Retest the broken trendline to form the final higher low.
-Begin expansion to the next major liquidity magnets:
-Short-term targets: 3,600 → 3,800
-Mid-term continuation: 4,200 → 4,500
-Macro target: 4,800–5,000 resistance zone
This is fully aligned with the green arrow projection you drew.
4. Market Psychology
-Big players are actively accumulating within this wide range clear repeated liquidity sweeps prove institutional activity.
-Retail traders are losing positions during sudden spikes and false breakdowns, which is typical behavior during accumulation phases.
-The market is more likely preparing for a major trend reversal, not a continuation downward.
-The price behavior mirrors earlier patterns:
Accumulation → Trendline Break → HL Retest → Massive Expansion
-This repetition increases confidence in the bullish outlook.
5. Intraday Strategy Guidance (1D)
Given the macro accumulation:
-Avoid selling aggressively the probability is against sustained bearish continuation.
-Best opportunities come from buying dips inside the accumulation zone.
-Watch for liquidity sweeps below local lows to identify smart-money entries.
High-probability setups:
✔️ Strategy 1: Buy the Bottom of the Range
Entry zones: 2,750–3,150
Targets: 3,600 → 3,800
✔️ Strategy 2: Buy the Retest After Trendline Breakout
This is the cleanest and safest setup.
Targets: 4,200 → 4,500 → 4,800+
ETH is currently in the prime zone where large investors position themselves before a new bullish cycle.
1. Current Price Structure
- ETH previously completed a strong bullish impulsive wave, breaking through multiple resistance levels before reaching the major 4,800–5,000 resistance zone, where the market formed a clear distribution top.
-After distribution, price entered a large corrective decline, following the descending dotted trendline visible on your chart.
-Recently, ETH has formed a broad accumulation block (highlighted in green), similar to the previous accumulation phases that triggered massive ETH rallies earlier in the year.
Inside this zone, ETH is now building a series of higher lows, showing early signs of bullish reconstruction.
-The current rising green structure indicates that price is forming a stair-step bullish pattern, preparing for a potential macro reversal.
2. Key Liquidity Zones
-Major Resistance Zone: 4,800–5,000
-This is the next major destination if ETH successfully completes the accumulation and transitions into expansion.
-Accumulation Block: 2,750–3,150
-This is where smart money is currently active — sweeping liquidity, trapping sellers, and accumulating long positions.
-Multiple liquidity grabs have already occurred inside this range, confirming strong institutional absorption.
-The current structure closely mirrors previous accumulation rectangles on the chart that led to massive bullish expansions.
3. Today's Market Scenario (1D Outlook)
Matches perfectly with the upward projection on your chart.
🔹 Main Scenario – Bullish Continuation After Accumulation
ETH is likely to follow this sequence:
-Continue building higher lows inside the accumulation block.
-Retest the inner structure trendline without breaking the macro zone.
-Form a clean break above the descending dotted trendline — signaling a bullish structure shift.
-Retest the broken trendline to form the final higher low.
-Begin expansion to the next major liquidity magnets:
-Short-term targets: 3,600 → 3,800
-Mid-term continuation: 4,200 → 4,500
-Macro target: 4,800–5,000 resistance zone
This is fully aligned with the green arrow projection you drew.
4. Market Psychology
-Big players are actively accumulating within this wide range clear repeated liquidity sweeps prove institutional activity.
-Retail traders are losing positions during sudden spikes and false breakdowns, which is typical behavior during accumulation phases.
-The market is more likely preparing for a major trend reversal, not a continuation downward.
-The price behavior mirrors earlier patterns:
Accumulation → Trendline Break → HL Retest → Massive Expansion
-This repetition increases confidence in the bullish outlook.
5. Intraday Strategy Guidance (1D)
Given the macro accumulation:
-Avoid selling aggressively the probability is against sustained bearish continuation.
-Best opportunities come from buying dips inside the accumulation zone.
-Watch for liquidity sweeps below local lows to identify smart-money entries.
High-probability setups:
✔️ Strategy 1: Buy the Bottom of the Range
Entry zones: 2,750–3,150
Targets: 3,600 → 3,800
✔️ Strategy 2: Buy the Retest After Trendline Breakout
This is the cleanest and safest setup.
Targets: 4,200 → 4,500 → 4,800+
ETH is currently in the prime zone where large investors position themselves before a new bullish cycle.
MY COMMUNITY GROUP FREE SIGNAL
✅ 100% Free — I don’t take a penny from anyone
✅ Free Signal: 4 - 6 signals
✅ Trading Idea / Setup / Technical
✅ JOIN MY COMMUNITY GROUP IN Telegram:
t.me/+2pCKgjf_zxplMmQ1
✅ 100% Free — I don’t take a penny from anyone
✅ Free Signal: 4 - 6 signals
✅ Trading Idea / Setup / Technical
✅ JOIN MY COMMUNITY GROUP IN Telegram:
t.me/+2pCKgjf_zxplMmQ1
Related publications
Disclaimer
The information and publications are not meant to be, and do not constitute, financial, investment, trading, or other types of advice or recommendations supplied or endorsed by TradingView. Read more in the Terms of Use.