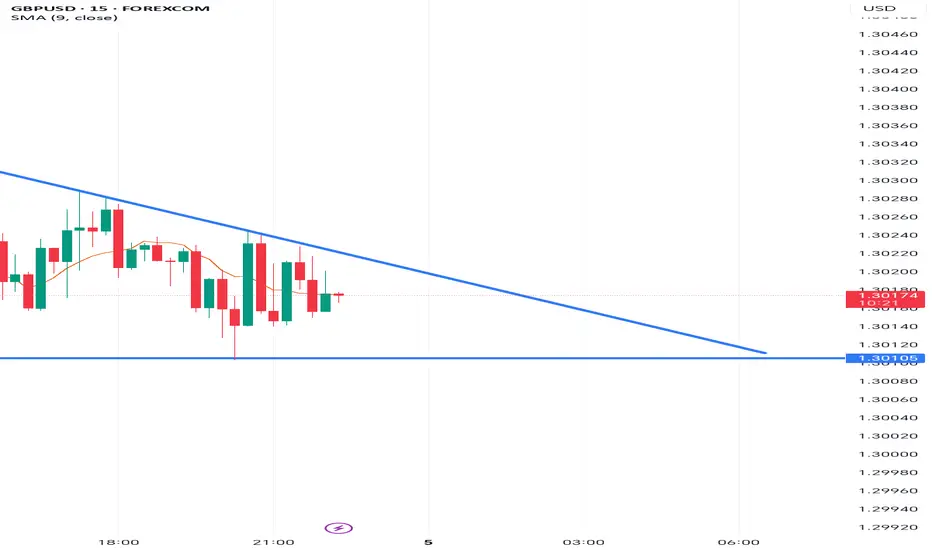
GBP/USD on the 15-minute chart is forming a descending triangle pattern, indicating potential bearish continuation pressure. The pair is currently trading around 1.3017, testing the strong horizontal support zone near 1.3010, while lower highs are being capped by a descending trendline resistance.
The 9-period SMA is trending slightly downward, reinforcing short-term bearish momentum. A break below 1.3010 could trigger a sharper move toward the 1.2990–1.2980 area. Conversely, if bulls manage to defend this support and push above the descending trendline, we could see a relief rally toward 1.3035–1.3050.
Trading Plan:
📉 Sell below 1.3010 with targets at 1.2990 / 1.2975, stop loss above 1.3025.
📈 Buy above 1.3035 with targets at 1.3055 / 1.3070, stop loss below 1.3015.
Bias: Bearish while below trendline resistance.
Pattern: Descending Triangle
Timeframe: 15M
📊 Keep an eye on the breakout — the next candle could confirm direction.
Disclaimer
The information and publications are not meant to be, and do not constitute, financial, investment, trading, or other types of advice or recommendations supplied or endorsed by TradingView. Read more in the Terms of Use.
Disclaimer
The information and publications are not meant to be, and do not constitute, financial, investment, trading, or other types of advice or recommendations supplied or endorsed by TradingView. Read more in the Terms of Use.