📝 Market Overview:
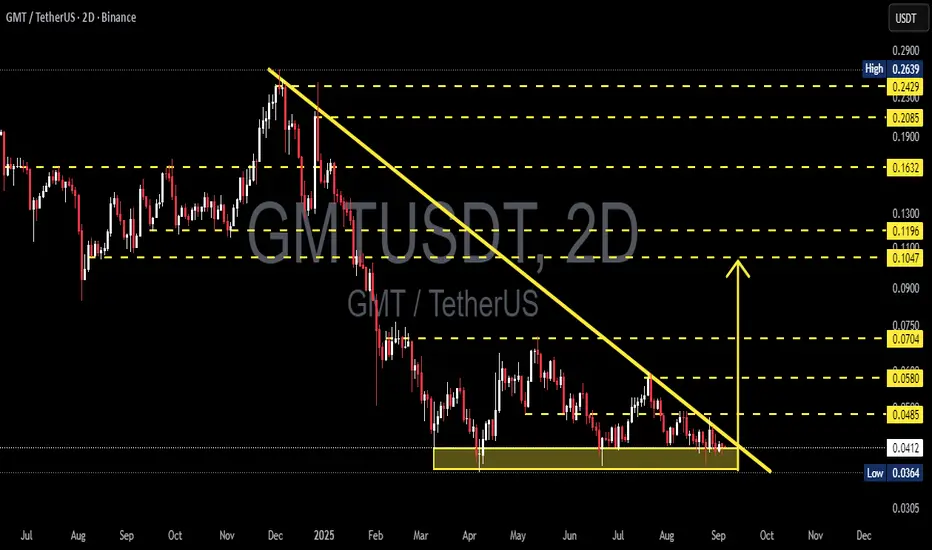
Since the early 2025 peak, GMT has been in a clear downtrend, consistently forming lower highs along the descending trendline (yellow).
Price is now consolidating within a major support zone at 0.0364 – 0.0413, which has been tested multiple times.
The structure forms a Descending Triangle: flat support + lower highs. Statistically, this pattern carries a bearish continuation bias, but a reversal scenario is not ruled out if bulls manage to reclaim key levels.
---
🔎 Pattern Significance
A Descending Triangle occurs when sellers keep pressing with lower highs, while buyers are forced to defend the same horizontal level.
➡️ Default bias: bearish (higher probability of breakdown, ~60–65%).
➡️ However, a strong breakout above the trendline often triggers a short squeeze, flipping sentiment and leading to a bullish reversal.
---
📊 Bearish Scenario (Dominant Bias)
Trigger: 2D candle close below 0.0364 with strong volume.
Target: Measured move (0.0485 – 0.0364 = 0.0121).
Breakdown projection → 0.0243.
Extra confirmation: Failed retest of broken support turning into resistance.
Risk: A weak-volume breakdown could lead to a fake-out and quick rebound.
---
📈 Bullish Scenario (Needs Strong Confirmation)
Trigger: 2D close above descending trendline and above first resistance 0.0485.
Initial targets: 0.0580 → 0.0704.
Extended target: 0.1047 if momentum builds.
Best confirmation: Successful retest of 0.0485 as new support with increased buying volume.
---
⚖️ Conclusion
The 0.036–0.041 zone is a “make-or-break” level for GMT.
As long as this support holds, bulls still have a fighting chance.
But the descending triangle pattern leans bearish → breakdown towards 0.024 remains a strong risk.
Traders should wait for a 2D candle confirmation with volume before committing to either direction.
---
📌 Trading Checklist
1. Focus on 2D candle closes (not intraday wicks).
2. Watch for volume confirmation on breakouts/breakdowns.
3. Prefer setups with retest + rejection for higher reliability.
4. Place stop-loss around invalidation levels (above resistance or below support).
5. Maintain strict risk management (R:R at least 1:2).
---
🔑 Key Technical Levels
Main Support: 0.0364 – 0.0413
Resistances: 0.0485 → 0.0580 → 0.0704 → 0.1047
Bearish target (breakdown): ~0.0243
Bullish targets (if breakout): 0.0580 → 0.0704
---
#GMT #GMTUSDT #Crypto #Altcoins #TechnicalAnalysis #DescendingTriangle #Breakout #Breakdown #SupportResistance #ChartPattern
✅ Get Free Signals! Join Our Telegram Channel Here: t.me/TheCryptoNuclear
✅ Twitter: twitter.com/crypto_nuclear
✅ Join Bybit : partner.bybit.com/b/nuclearvip
✅ Benefits : Lifetime Trading Fee Discount -50%
✅ Twitter: twitter.com/crypto_nuclear
✅ Join Bybit : partner.bybit.com/b/nuclearvip
✅ Benefits : Lifetime Trading Fee Discount -50%
Disclaimer
The information and publications are not meant to be, and do not constitute, financial, investment, trading, or other types of advice or recommendations supplied or endorsed by TradingView. Read more in the Terms of Use.