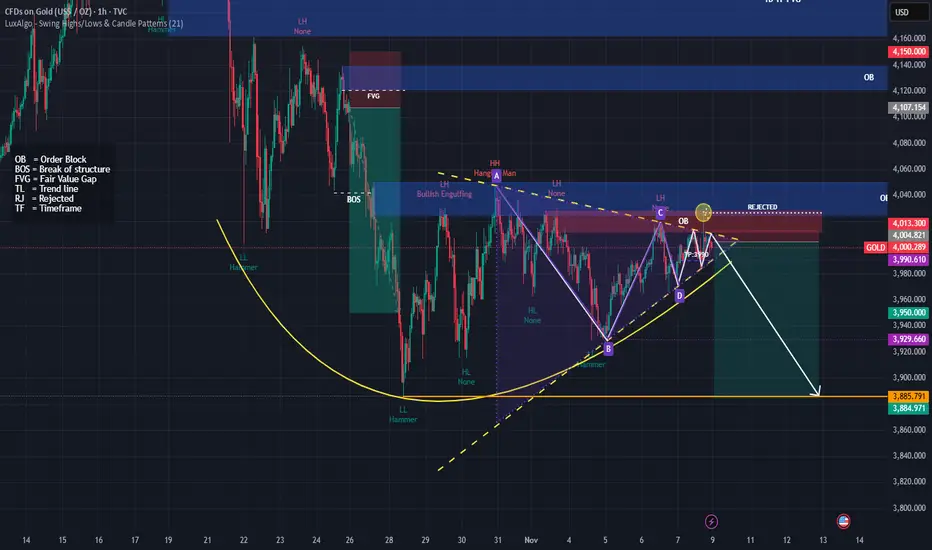
🧭 Overall Structure
The chart shows a potential bearish setup.
I have drawn a descending pattern (A-B-C-D) with rejection from an Order Block (OB) around $4,013–$4,020.
The white arrow projects a downward move toward 3,885.
🔍 Key Technical Elements
1. Order Blocks (OB)
Upper OB (~4,150–4,120): Higher timeframe supply zone; strong resistance if price rallies.
Current OB (~4,013–4,040): Recently rejected here — price reacted and failed to make a new higher high → confirms seller pressure.
2. Break of Structure (BOS)
A previous BOS occurred to the downside, suggesting bearish momentum took control after a temporary bullish leg.
3. Trend Lines (Yellow Dashed)
The upper TL connects lower highs → consistent downtrend.
The lower TL (support) was recently tested and might break soon — signaling bearish continuation.
4. Pattern
A–B–C–D harmonic-like pattern completed near the order block, often signaling a sell opportunity when it aligns with rejection zones.
Price formed a lower high (LH) at point C and another at D → confirms trend weakness.
5. Candlestick Rejection
“Rejected” and “Hammer” labels near point D and OB zone show failed bullish attempts → adds confluence for short.
🎯 Bearish Targets
TP1: 3,950 (nearest support)
TP2: 3,930 (previous low)
TP3 (Major): 3,885 (strong historical support zone)
⚠️ Invalidation
If price closes above 4,040–4,060 (OB zone), bearish setup invalidates.
That would mean liquidity grab and possible push toward 4,100–4,150 OB.
🧩 Summary
Bias Entry Zone Confirmation Targets Invalidation
Bearish 4,010–4,020 OB zone Rejection + lower high 3,950 → 3,930 → 3,885 Close above 4,060
Disclaimer
The information and publications are not meant to be, and do not constitute, financial, investment, trading, or other types of advice or recommendations supplied or endorsed by TradingView. Read more in the Terms of Use.
Disclaimer
The information and publications are not meant to be, and do not constitute, financial, investment, trading, or other types of advice or recommendations supplied or endorsed by TradingView. Read more in the Terms of Use.