ICICIGI: Weekly Triangle Squeeze | Explosive Move Expected Soon
BUY Setup 🛡️
Entry: ₹2,040-2,050 (Current Level)
Target 1: ₹2,080-2,100
Target 2: ₹2,150-2,180
Target 3: ₹2,250+ (Extended - Post Breakout)
Stop Loss: ₹1,975
Technical Rationale:
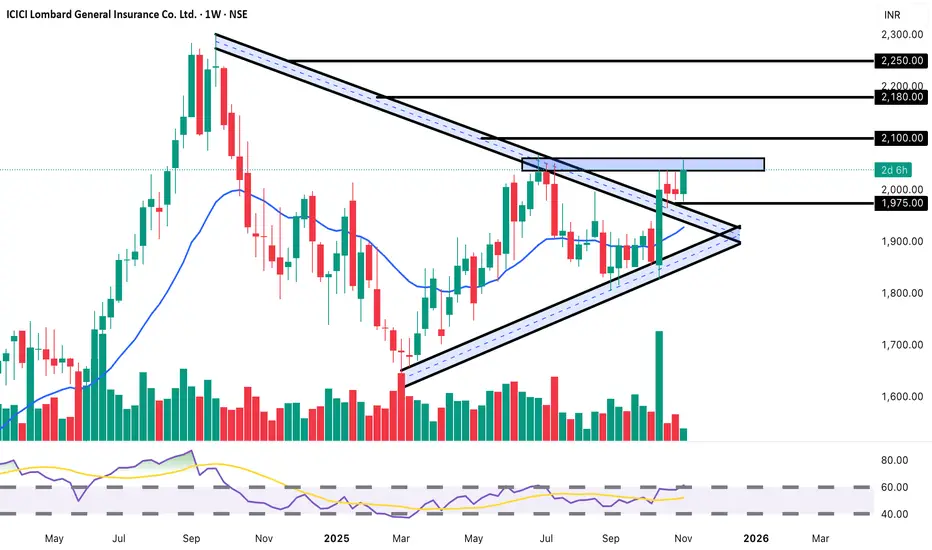
MAJOR PATTERN: Symmetrical Triangle forming on Weekly chart - apex approaching
Trading at upper boundary of triangle - breakout imminent (marked "2d 6h")
Strong +2.32% gain today showing bullish momentum
Volume at 11M - showing increased participation
Price testing critical resistance at 2,000-2,050 zone
Multiple convergence of trendlines creating decision point
RSI around 60 - neutral to bullish zone with room for upside
Trading above EMA on higher timeframes
Insurance sector showing relative strength
Triangle pattern spanning 6+ months - significant breakout potential
Support at ascending trendline around 1,975
Risk-Reward: Excellent 1:3+ ratio (much higher if triangle breaks out)
Pattern: Symmetrical Triangle on Weekly Chart - one of the most powerful continuation patterns. Breakout from 6-month consolidation could trigger massive move.
Strategy:
Conservative: Wait for weekly close above 2,060 with volume for confirmation
Aggressive: Enter now with SL below triangle support at 1,975
Book 25% at T1 (2,090), 25% at T2 (2,165), hold 50% for major breakout target 2,250-2,300
Key Levels:
CRITICAL Breakout Zone: 2,050-2,060 (triangle apex)
Strong Resistance: 2,000-2,050 (current battle zone)
Extended Targets: 2,250, 2,300+ (measured move from triangle)
Major Support: 1,975 (triangle support), 1,900
Timeframe: Weekly chart - suitable for positional/swing trading (weeks to months)
Triangle Measured Move: If breaks above 2,060, target = 2,300+ (height of triangle added to breakout point)
Volume Watch: Need strong volume on breakout for confirmation
Disclaimer: For educational purposes only. Not SEBI registered.
Entry: ₹2,040-2,050 (Current Level)
Target 1: ₹2,080-2,100
Target 2: ₹2,150-2,180
Target 3: ₹2,250+ (Extended - Post Breakout)
Stop Loss: ₹1,975
Technical Rationale:
MAJOR PATTERN: Symmetrical Triangle forming on Weekly chart - apex approaching
Trading at upper boundary of triangle - breakout imminent (marked "2d 6h")
Strong +2.32% gain today showing bullish momentum
Volume at 11M - showing increased participation
Price testing critical resistance at 2,000-2,050 zone
Multiple convergence of trendlines creating decision point
RSI around 60 - neutral to bullish zone with room for upside
Trading above EMA on higher timeframes
Insurance sector showing relative strength
Triangle pattern spanning 6+ months - significant breakout potential
Support at ascending trendline around 1,975
Risk-Reward: Excellent 1:3+ ratio (much higher if triangle breaks out)
Pattern: Symmetrical Triangle on Weekly Chart - one of the most powerful continuation patterns. Breakout from 6-month consolidation could trigger massive move.
Strategy:
Conservative: Wait for weekly close above 2,060 with volume for confirmation
Aggressive: Enter now with SL below triangle support at 1,975
Book 25% at T1 (2,090), 25% at T2 (2,165), hold 50% for major breakout target 2,250-2,300
Key Levels:
CRITICAL Breakout Zone: 2,050-2,060 (triangle apex)
Strong Resistance: 2,000-2,050 (current battle zone)
Extended Targets: 2,250, 2,300+ (measured move from triangle)
Major Support: 1,975 (triangle support), 1,900
Timeframe: Weekly chart - suitable for positional/swing trading (weeks to months)
Triangle Measured Move: If breaks above 2,060, target = 2,300+ (height of triangle added to breakout point)
Volume Watch: Need strong volume on breakout for confirmation
Disclaimer: For educational purposes only. Not SEBI registered.
Disclaimer
The information and publications are not meant to be, and do not constitute, financial, investment, trading, or other types of advice or recommendations supplied or endorsed by TradingView. Read more in the Terms of Use.
Disclaimer
The information and publications are not meant to be, and do not constitute, financial, investment, trading, or other types of advice or recommendations supplied or endorsed by TradingView. Read more in the Terms of Use.