Overview
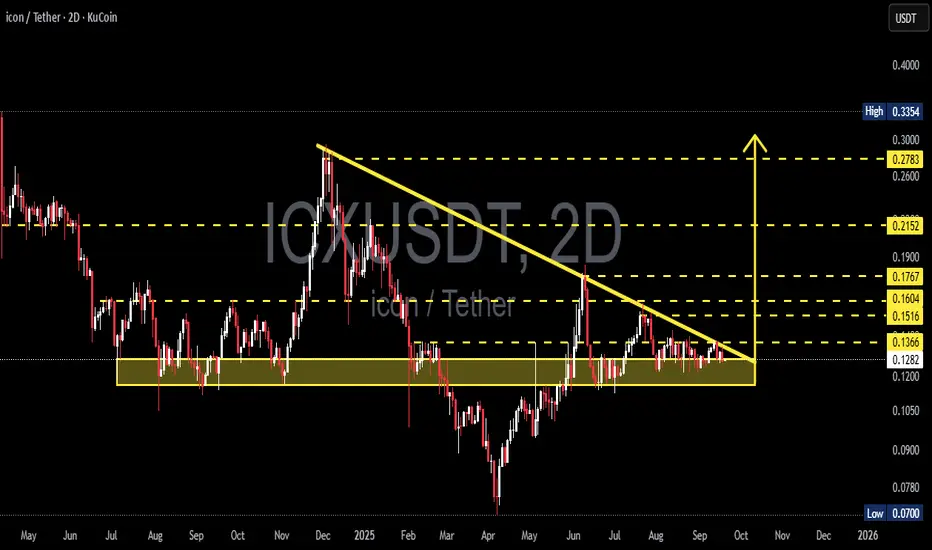
ICX is currently at a critical stage. Price has been consolidating for months within the strong demand zone at 0.11–0.13, while being consistently pressured by a descending trendline from late 2024 highs. This structure has formed a Descending Triangle / Compression pattern, where volatility is contracting, signaling that a major move is imminent.
The setup is classic: the longer the squeeze, the stronger the breakout when it comes. The question is — will ICX break to the upside or collapse below support?
---
Key Levels
Demand zone (major support): 0.11 – 0.13
Immediate resistance (trendline + horizontal): 0.1366
Upside resistance targets: 0.1516 → 0.1604 → 0.1767 → 0.2152 → 0.2783 → 0.3354
Breakdown targets: 0.09 → 0.07
---
Pattern Explanation
Descending Triangle: consistent lower highs (selling pressure) while buyers defend a flat support zone.
Statistically, this pattern leans bearish, but when it forms near a strong demand zone after a prolonged downtrend, it can also serve as a base for reversal.
ICX is now at the apex of the triangle → volatility has compressed and a breakout/breakdown is highly likely soon.
---
Bullish Scenario
Trigger: a 2D close above the descending trendline with rising volume.
Additional confirmation: successful retest of the breakout zone around 0.1366.
Upside targets:
TP1: 0.1516
TP2: 0.1604 – 0.1767
TP3: 0.2152
Extended: 0.2783 → 0.3354
Stop Loss: below demand zone (~0.105)
---
Bearish Scenario
Trigger: a 2D close below 0.11–0.105 with strong selling volume.
Downside targets:
Initial: 0.09
Extended: 0.07 (major chart low)
Stop Loss for shorts: reclaim above 0.13–0.1366
---
Sentiment & Momentum
Volume: currently declining, showing the market is waiting for a trigger before the next big move.
Momentum: RSI & MACD remain neutral, supporting the potential for a strong move once breakout occurs.
Market structure:
If support breaks → fast drop toward 0.09–0.07
If support holds → strong base for mid-term reversal
---
Conclusion
ICX is at a make-or-break point:
Bullish case: breakout above trendline could ignite a rally toward 0.15–0.21 and beyond.
Bearish case: breakdown below support opens the path to 0.09 or even 0.07.
Wait for 2D close with volume confirmation before entering. Manage risk properly — this is not the place to trade without discipline.
Not financial advice — purely technical analysis. DYOR & use risk management.
---
ICX/USDT is forming a Descending Triangle at the 0.11–0.13 demand zone.
Volatility is tightening → expect a major breakout or breakdown soon.
✅ Bullish: 2D close > trendline → targets 0.1516 / 0.1767 / 0.2152
❌ Bearish: 2D close < 0.105 → targets 0.09 / 0.07
Watch volume + 2D close for confirmation.
Trading without risk management = suicide.
---
#ICX #ICON #ICXUSDT #CryptoAnalysis #TechnicalAnalysis #DescendingTriangle #SupportResistance #Breakout
✅ Get Free Signals! Join Our Telegram Channel Here: t.me/TheCryptoNuclear
✅ Twitter: twitter.com/crypto_nuclear
✅ Join Bybit : partner.bybit.com/b/nuclearvip
✅ Benefits : Lifetime Trading Fee Discount -50%
✅ Twitter: twitter.com/crypto_nuclear
✅ Join Bybit : partner.bybit.com/b/nuclearvip
✅ Benefits : Lifetime Trading Fee Discount -50%
Disclaimer
The information and publications are not meant to be, and do not constitute, financial, investment, trading, or other types of advice or recommendations supplied or endorsed by TradingView. Read more in the Terms of Use.