📌 Key Data & Trend Context
Recent price: around ₹ 404 (or in the ~₹ 401–409 range depending on source/time).
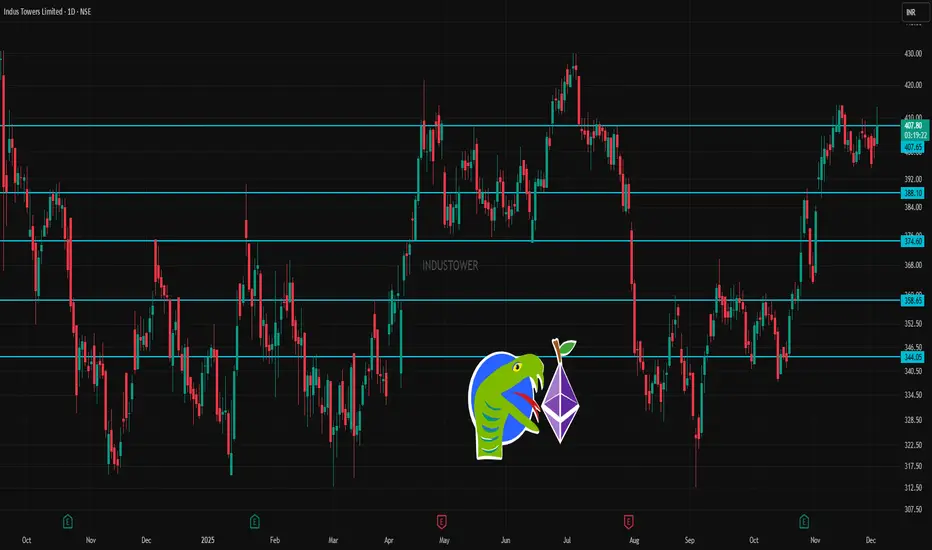
52‑week range: Low ≈ ₹ 312.55, High ≈ ₹ 430.00.
According to moving averages (short‑, mid‑ & long‑term), trend is marked “outperform” / bullish.
✅ What This Suggests (in 1‑day / Short-Term Context)
As long as price holds above ₹ 388–392, the near‑term trend remains stable / bullish.
A close above ₹ 405–408 on decent volume may signal a bullish breakout — could push toward ₹ 424–438 range.
On a drop below ₹ 338–346, the stock could weaken significantly — suggesting caution or a bearish tilt.
Given moving averages (short + mid + long) are in bullish alignment, intermediate‑term bias remains positive.
Recent price: around ₹ 404 (or in the ~₹ 401–409 range depending on source/time).
52‑week range: Low ≈ ₹ 312.55, High ≈ ₹ 430.00.
According to moving averages (short‑, mid‑ & long‑term), trend is marked “outperform” / bullish.
✅ What This Suggests (in 1‑day / Short-Term Context)
As long as price holds above ₹ 388–392, the near‑term trend remains stable / bullish.
A close above ₹ 405–408 on decent volume may signal a bullish breakout — could push toward ₹ 424–438 range.
On a drop below ₹ 338–346, the stock could weaken significantly — suggesting caution or a bearish tilt.
Given moving averages (short + mid + long) are in bullish alignment, intermediate‑term bias remains positive.
Related publications
Disclaimer
The information and publications are not meant to be, and do not constitute, financial, investment, trading, or other types of advice or recommendations supplied or endorsed by TradingView. Read more in the Terms of Use.
Related publications
Disclaimer
The information and publications are not meant to be, and do not constitute, financial, investment, trading, or other types of advice or recommendations supplied or endorsed by TradingView. Read more in the Terms of Use.