Struggling Intel  INTC had its best market session in nearly four decades the other day when Nvidia
  NVDA unexpectedly announced plans to invest $5 billion in the company. Does INTC's chart show this is the start of an uptrend -- or just a short-term rebound?
Let's take a look:
Nvidia's Intel Deal
I'll admit I didn't see it coming when Nvidia and Intel announced a headline-making deal last Thursday to jointly develop PC and data-center-friendly chips.
As part of the agreement, Nvidia announced a $5 billion investment in Intel at $23.28 per share, pending regulatory approval.
Intel shot up as much as 30% intraday on the news -- its biggest one-day percentage gain in 38 years.
Nvidia gained 3.5% as well, while INTC rival Advanced Micro Devices AMD briefly dropped 5.8% intraday. AMD competes directly with Intel for share in the PC/CPU business, while also providing the only real competition to Nvidia at the AI/data-center design level.
As for Intel, it's since given back some of last Thursday's big gains, but was trading Wednesday afternoon at about $30.80 a share. That's up some 23% since the Nvidia announcement, as well as 74.3% from the stock's $17.67 52-week low set on April 8.
Intel's Technical Analysis
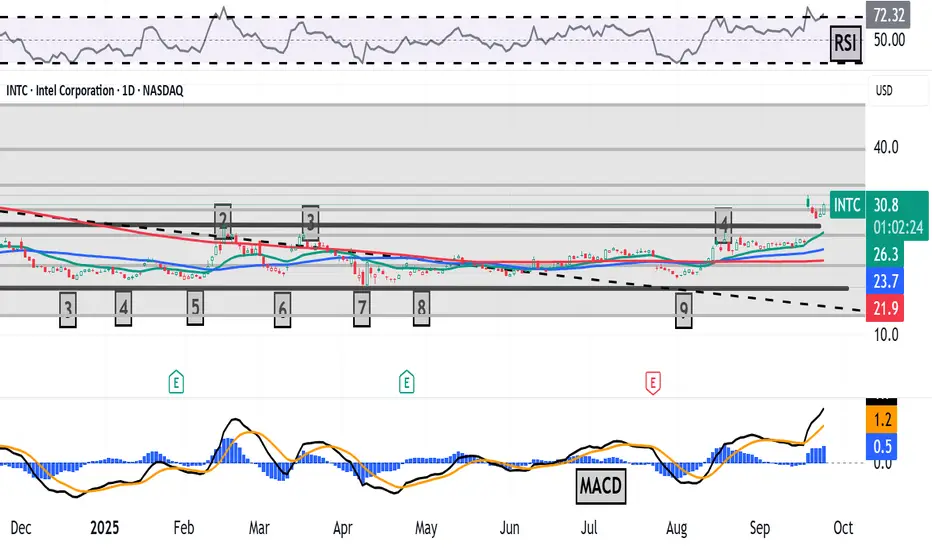
Now let's take a look at INTC's chart going back some nine months and running through Thursday's close:

What readers will see here is a so-called "flat base" for the stock that ran for more than 12 months, with a $27.55 pivot.
Intel broke out of that in response to the Nvidia news, but investors have to be cognizant of the looming halfway-back point -- a 50% retracement of the stock's December 2023-April 2025 sell-off.
That spot, which stands at about $34.50, has potential to show resistance in the face of Intel's sudden surge.
Most Fibonacci retracement models include 50% retracements even though they're not actual Fibonacci levels. Twelfth-century Italian mathematician Leonardo Bonacci never included a 50% retracement level for his sequence.
However, that does not make them any less real. So, if the halfway-back point presents potential resistance for Intel, where does the stock's support level sit?
Potentially at the old flat base's upper trendline, which was Intel's old pivot of $27.55.
An Options Option
Options traders who want to get long on Intel, but not get picked off close to potential resistance often employ a simple buy-write strategy.
This is accomplished by buying INTC shares while also decreasing net basis by writing a call with a higher strike price.
Here's an example:
-- Buy 100 shares of INTC at about $32.
-- Sell (write) one INTC Oct. 24 $34 call for about $2.
Net Basis: $30.
A trader wanting to lower cost basis even more might consider one additional step. They could write a put with a strike price down around the stock's potential support level if the trader is willing to add to their long INTC position at that price:
-- Sell (write) one INTC Oct. 24 $27.50 put for roughly $0.85.
New Net Basis: $29.15.
(Moomoo Technologies Inc. Markets Commentator Stephen “Sarge” Guilfoyle had no position in INTC at the time of writing this column, but was long NVDA and AMD.)
This article discusses technical analysis, other approaches, including fundamental analysis, may offer very different views. The examples provided are for illustrative purposes only and are not intended to be reflective of the results you can expect to achieve. Specific security charts used are for illustrative purposes only and are not a recommendation, offer to sell, or a solicitation of an offer to buy any security. Past investment performance does not indicate or guarantee future success. Returns will vary, and all investments carry risks, including loss of principal. This content is also not a research report and is not intended to serve as the basis for any investment decision. The information contained in this article does not purport to be a complete description of the securities, markets, or developments referred to in this material. Moomoo and its affiliates make no representation or warranty as to the article's adequacy, completeness, accuracy or timeliness for any particular purpose of the above content. Furthermore, there is no guarantee that any statements, estimates, price targets, opinions or forecasts provided herein will prove to be correct.
Options trading is risky and not appropriate for everyone. Read the Options Disclosure Document (https://j.moomoo.com/017y9J) before trading. Options are complex and you may quickly lose the entire investment. Supporting docs for any claims will be furnished upon request.
Options trading subject to eligibility requirements. Strategies available will depend on options level approved.
Moomoo is a financial information and trading app offered by Moomoo Technologies Inc. In the U.S., investment products and services on Moomoo are offered by Moomoo Financial Inc., Member FINRA/SIPC.
TradingView is an independent third party not affiliated with Moomoo Financial Inc., Moomoo Technologies Inc., or its affiliates. Moomoo Financial Inc. and its affiliates do not endorse, represent or warrant the completeness and accuracy of the data and information available on the TradingView platform and are not responsible for any services provided by the third-party platform.
Let's take a look:
Nvidia's Intel Deal
I'll admit I didn't see it coming when Nvidia and Intel announced a headline-making deal last Thursday to jointly develop PC and data-center-friendly chips.
As part of the agreement, Nvidia announced a $5 billion investment in Intel at $23.28 per share, pending regulatory approval.
Intel shot up as much as 30% intraday on the news -- its biggest one-day percentage gain in 38 years.
Nvidia gained 3.5% as well, while INTC rival Advanced Micro Devices
As for Intel, it's since given back some of last Thursday's big gains, but was trading Wednesday afternoon at about $30.80 a share. That's up some 23% since the Nvidia announcement, as well as 74.3% from the stock's $17.67 52-week low set on April 8.
Intel's Technical Analysis
Now let's take a look at INTC's chart going back some nine months and running through Thursday's close:
What readers will see here is a so-called "flat base" for the stock that ran for more than 12 months, with a $27.55 pivot.
Intel broke out of that in response to the Nvidia news, but investors have to be cognizant of the looming halfway-back point -- a 50% retracement of the stock's December 2023-April 2025 sell-off.
That spot, which stands at about $34.50, has potential to show resistance in the face of Intel's sudden surge.
Most Fibonacci retracement models include 50% retracements even though they're not actual Fibonacci levels. Twelfth-century Italian mathematician Leonardo Bonacci never included a 50% retracement level for his sequence.
However, that does not make them any less real. So, if the halfway-back point presents potential resistance for Intel, where does the stock's support level sit?
Potentially at the old flat base's upper trendline, which was Intel's old pivot of $27.55.
An Options Option
Options traders who want to get long on Intel, but not get picked off close to potential resistance often employ a simple buy-write strategy.
This is accomplished by buying INTC shares while also decreasing net basis by writing a call with a higher strike price.
Here's an example:
-- Buy 100 shares of INTC at about $32.
-- Sell (write) one INTC Oct. 24 $34 call for about $2.
Net Basis: $30.
A trader wanting to lower cost basis even more might consider one additional step. They could write a put with a strike price down around the stock's potential support level if the trader is willing to add to their long INTC position at that price:
-- Sell (write) one INTC Oct. 24 $27.50 put for roughly $0.85.
New Net Basis: $29.15.
(Moomoo Technologies Inc. Markets Commentator Stephen “Sarge” Guilfoyle had no position in INTC at the time of writing this column, but was long NVDA and AMD.)
This article discusses technical analysis, other approaches, including fundamental analysis, may offer very different views. The examples provided are for illustrative purposes only and are not intended to be reflective of the results you can expect to achieve. Specific security charts used are for illustrative purposes only and are not a recommendation, offer to sell, or a solicitation of an offer to buy any security. Past investment performance does not indicate or guarantee future success. Returns will vary, and all investments carry risks, including loss of principal. This content is also not a research report and is not intended to serve as the basis for any investment decision. The information contained in this article does not purport to be a complete description of the securities, markets, or developments referred to in this material. Moomoo and its affiliates make no representation or warranty as to the article's adequacy, completeness, accuracy or timeliness for any particular purpose of the above content. Furthermore, there is no guarantee that any statements, estimates, price targets, opinions or forecasts provided herein will prove to be correct.
Options trading is risky and not appropriate for everyone. Read the Options Disclosure Document (https://j.moomoo.com/017y9J) before trading. Options are complex and you may quickly lose the entire investment. Supporting docs for any claims will be furnished upon request.
Options trading subject to eligibility requirements. Strategies available will depend on options level approved.
Moomoo is a financial information and trading app offered by Moomoo Technologies Inc. In the U.S., investment products and services on Moomoo are offered by Moomoo Financial Inc., Member FINRA/SIPC.
TradingView is an independent third party not affiliated with Moomoo Financial Inc., Moomoo Technologies Inc., or its affiliates. Moomoo Financial Inc. and its affiliates do not endorse, represent or warrant the completeness and accuracy of the data and information available on the TradingView platform and are not responsible for any services provided by the third-party platform.
Disclaimer
The information and publications are not meant to be, and do not constitute, financial, investment, trading, or other types of advice or recommendations supplied or endorsed by TradingView. Read more in the Terms of Use.
Disclaimer
The information and publications are not meant to be, and do not constitute, financial, investment, trading, or other types of advice or recommendations supplied or endorsed by TradingView. Read more in the Terms of Use.