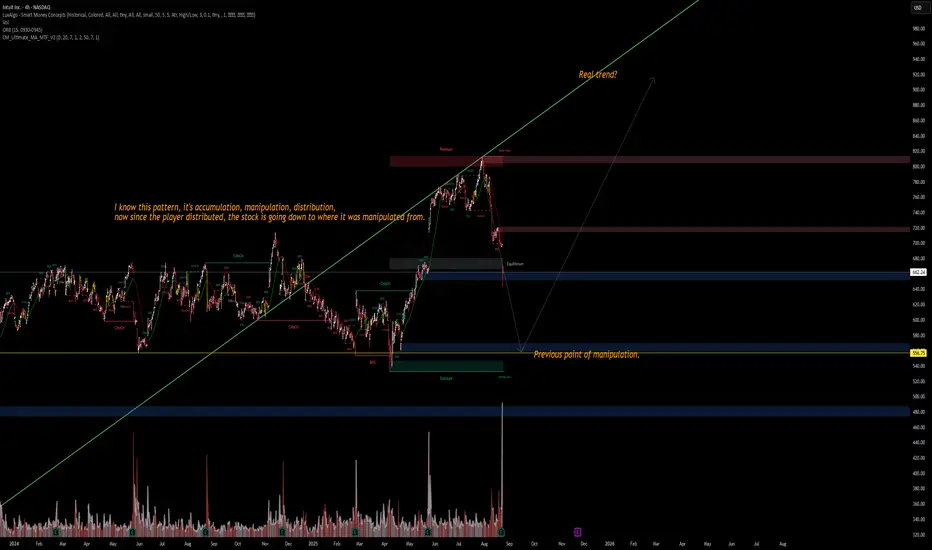
📉 INTU – Market Structure Breakdown
I recognize this setup:
Accumulation ➝ Manipulation ➝ Distribution.
After distribution at the premium zone, price is now breaking down toward the previous point of manipulation.
🔹 Current price: ~662
🔹 Potential downside target: 556–560 zone (previous manipulation base)
🔹 If broken further → risk of deeper move into 480–500 discount range
Key Observations:
Multiple Change of Character (ChoCH) and Break of Structure (BOS) signals confirming distribution.
Volume spikes align with manipulation phases.
Real trend may resume only after price returns to equilibrium zones.
⚠️ Watch for liquidity grabs around 600–610 before continuation lower.
👉 My bias: Short-term bearish, targeting 560, with a potential trend resumption later.
#INTU #Trading #SmartMoney #Stocks
Disclaimer
The information and publications are not meant to be, and do not constitute, financial, investment, trading, or other types of advice or recommendations supplied or endorsed by TradingView. Read more in the Terms of Use.
Disclaimer
The information and publications are not meant to be, and do not constitute, financial, investment, trading, or other types of advice or recommendations supplied or endorsed by TradingView. Read more in the Terms of Use.