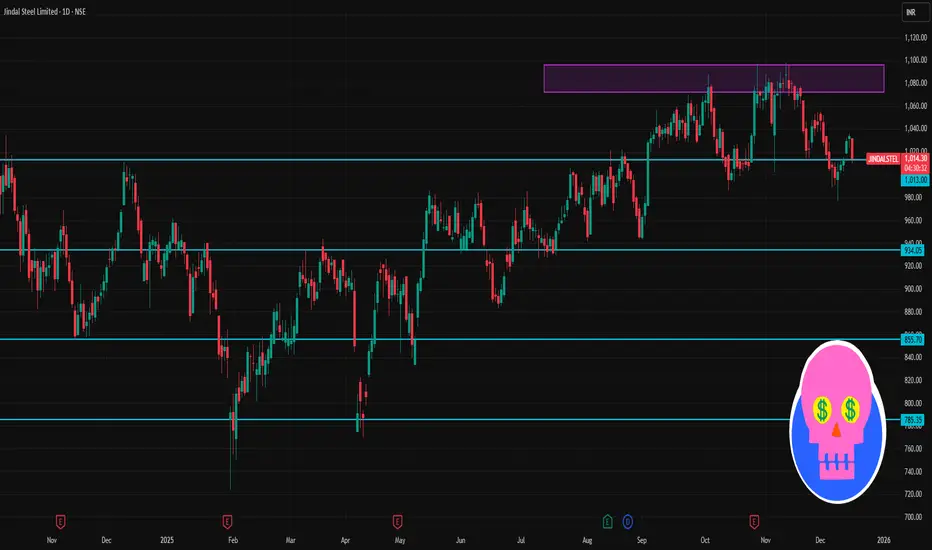
📊 Daily Pivot & Key Levels
Pivot Point (Reference): ~₹1,010–₹1,010.27
(This is the central level where direction bias flips intraday.)
🔼 Resistance Levels
R1: ~₹1,017.9 – ₹1,018 📈
R2: ~₹1,022.9 – ₹1,041 📈
R3: ~₹1,030.6 – ₹1,049.9 📈
(Breaking and holding above these can signal bullish strength.)
🔽 Support Levels
S1: ~₹1,005.2 – ₹1,006.2 📉
S2: ~₹997.5 – ₹1,012 📉
S3: ~₹992.5 – ₹1,006 📉
(These act as downside cushions — watch for bounces or breakdowns.)
📈 Short‑Term Bias & Indicators
Moving Averages: Near current price, shorter and medium SMAs/EMAs are tight — indicating potential range trading unless breakout occurs.
RSI: Around neutral (~49), not strongly overbought/oversold.
📊 How Traders Use These
Bullish Scenario: Price sustaining above Pivot → target R1 ➜ R2 ➜ R3.
Bearish Scenario: Price breaking below Pivot → test S1 ➜ S2 ➜ S3.
Range Trades: Buy near supports with stop just below; sell near resistance with stop just above.
Related publications
Disclaimer
The information and publications are not meant to be, and do not constitute, financial, investment, trading, or other types of advice or recommendations supplied or endorsed by TradingView. Read more in the Terms of Use.
Related publications
Disclaimer
The information and publications are not meant to be, and do not constitute, financial, investment, trading, or other types of advice or recommendations supplied or endorsed by TradingView. Read more in the Terms of Use.