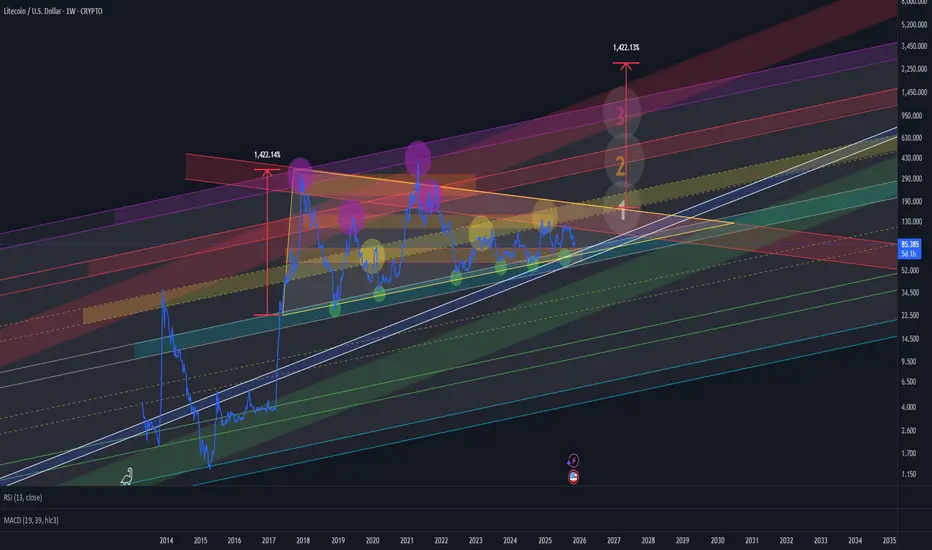
We have a blue horizontal accumulation zone, which has been acting as the cycle bottom area since 2018.
From this zone, long-term positions can be built with partial profit-taking targets at the yellow, red, and violet zones — each representing stages of distribution and de-risking from the accumulated position.
Additionally, we can observe a massive triangle formation.
If this pattern plays out, the breakout target zones are clearly indicated on the chart.
At the bottom, the blue line inside the white frame marks an additional support level, which may serve as a final retest zone before the next upward cycle.
Related publications
Disclaimer
The information and publications are not meant to be, and do not constitute, financial, investment, trading, or other types of advice or recommendations supplied or endorsed by TradingView. Read more in the Terms of Use.
Related publications
Disclaimer
The information and publications are not meant to be, and do not constitute, financial, investment, trading, or other types of advice or recommendations supplied or endorsed by TradingView. Read more in the Terms of Use.