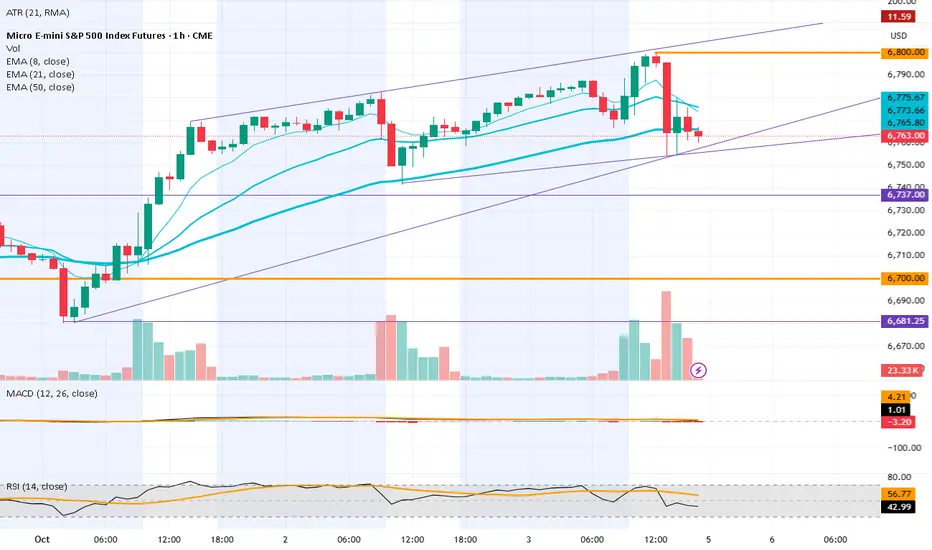
Chart Time Frame: 1 Hour
Current Price: 6763 after setting recent ATH at 6800
Daily Candle: Top Heavy Doji with open / close entire in the body of previous candle.
📈 Price Action & Technical Analysis
EMA 8 (thin cyan): ~6733 – Above price. Negative Slope.
EMA 21 (med cyan): ~6775 – Above price and EMA 8. Negative Slope. Rotation zone created on 1H and lower TF (EMA 8 crossed EMA 21). Crossover has not happened on higher TF's at time of post.
EMA 50 (thick cyan): ~6765 – Above current price; Flattening out.
Structure: Bullish Trending since April lows.
📈 RSI (14 Close) Current: 43 (57 MA)
Interpretation: Below neutral (50), momentum is weakening.
📈 MACD (12, 26, 9) MACD Line: 1; Signal Line: 4.2; Histogram: -3.2
Interpretation: MACD is growing bearish, histogram showing increasing intensity, yet still above 0.
🎯 Key Levels
Support: various possible trend lines shown (Purple). Price action Monday will determine their validity. Swing low at 6681.
Resistance: Overhead moving averages. ATH at 6800.
🧨 Volatility Outlook
VIX - After a decline, showing signs of inflection. Currently trending upwards on the daily TF.
Government shutdown and headline risk are of some concern to short term price action.
Short Term: A sudden opening of the government could certainly cause a bullish event. I could also imagine certain headlines that would cause a short term bearish event.
Longer term: govt shut downs have typically preceded bullish gains.
📈Macro/Fundamental Analysis
Interpretation: We are in between earnings seasons and with a Gov shutdown, void of Gov Data.
DXY - Pulled back significantly this year. I personally expect it to continue. This could provide a tail wind to equities pricing.
📆 Economic Calendar / Earnings Schedule
Econ Calendar: Relatively Light Next Week
Wednesday - 3PM EST - FOMC Minutes. Dot Plot could cause some action as the minutes are dissected.
Friday - 10AM - Michigan Consumer Sentiment Report. A big miss (up or down) could cause some action.
🔍 Summary
🔻 Trend: Long bull run - might be getting stale; Might just be getting started. You decide.
🧩 Momentum: Very high on longer TFs, Turning down on the lower.
🧠 Tactics:
Short Term - I love a 'rotation zone trade'. If price bounces back up into the EMA 21/8 spread zone, I would be looking for some day trade shorts.
Give me a THUMBS UP / COMMENTS / FOLLOW ME!
-Will
-Will
Disclaimer
The information and publications are not meant to be, and do not constitute, financial, investment, trading, or other types of advice or recommendations supplied or endorsed by TradingView. Read more in the Terms of Use.
Give me a THUMBS UP / COMMENTS / FOLLOW ME!
-Will
-Will
Disclaimer
The information and publications are not meant to be, and do not constitute, financial, investment, trading, or other types of advice or recommendations supplied or endorsed by TradingView. Read more in the Terms of Use.
