https://www.tradingview.com/x/QGzalipN/
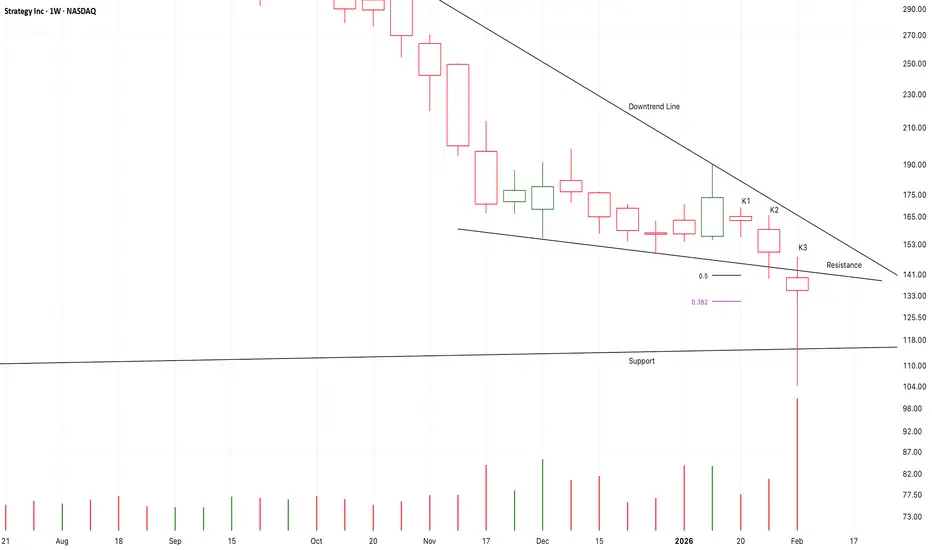
K3 verified a potential support here,
Perhaps it is an earlier signal of a potential bear bottom.
But it must break up the nearest downtrend line here,
And, the support must be verified by more tests.
It takes more time for a bear bottom than a bull top.
If the following candles fall to test the support,
I will try to buy it.
I am expecting the bear market of the bitcoin price target at about 56-50K area.
Disclaimer
The information and publications are not meant to be, and do not constitute, financial, investment, trading, or other types of advice or recommendations supplied or endorsed by TradingView. Read more in the Terms of Use.
Disclaimer
The information and publications are not meant to be, and do not constitute, financial, investment, trading, or other types of advice or recommendations supplied or endorsed by TradingView. Read more in the Terms of Use.