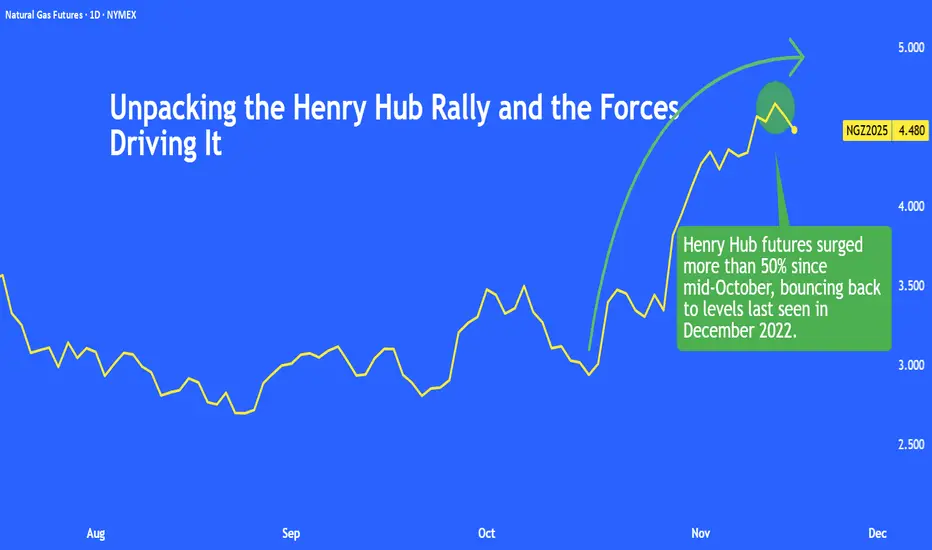
CME Henry Hub futures have surged since mid-October, reaching levels last seen in December 2022. This is an impressive rally given strong U.S. production and elevated inventories

This paper breaks down the key drivers behind the price spike and the market trends that continue to steer Henry Hub futures.
Surging LNG Demand Lifts Henry Hub Futures
The surge in CME Henry Hub futures was driven by strong export demand and record LNG activity. Flows to the eight major U.S. LNG terminals have averaged around 17.8 bcf/d this month, surpassing October’s record (16.7 bcf/d), as global buyers continue to seek U.S. supply.

Source: EIA
According to Reuters (via LSEG data), the U.S. became the first nation to export 10.1 million metric tonnes (mmt) of LNG in a single month in October, up from 9.1 mmt in September.
Europe remained the top destination, taking 6.9 mmt as the region rebuilt inventories ahead of winter and continued to diversify away from Russian gas.
Exports to Asia also climbed, supported by regional growth, energy transition policies, and Taiwan’s phaseout of nuclear power.
The EIA expects U.S. LNG exports to average 14.9 bcf/d this year (25% higher than 2024) and rise another 10% in 2026.
Rising domestic power demand, led by data centres’ soaring electricity use, adds another layer of structural support to gas consumption.
Together, robust export growth and strong power demand create a tighter domestic balance.
Colder Outlook Boosts Natural Gas Sentiment
Colder-than-expected winter forecasts sparked a mid-October rebound in Henry Hub futures as traders unwound shorts after weather models shifted toward stronger heating demand.
NOAA’s 16/Oct seasonal outlook indicated that La Niña conditions are likely to persist through winter, raising the probability of below-average temperatures across northern U.S. states.
These forecasts, while fluid, triggered a repricing of weather risk, with potential production disruptions and pipeline freeze-offs adding to market sensitivity.
The market is now focused on December’s cold risk: near-term demand may soften into Thanksgiving, but structural support and the prospect of a colder December continue to buoy sentiment. Meanwhile, record LNG exports provide a firm floor for Henry Hub prices this winter.
Henry Hub Gained Despite Rising Production and High Storage Levels
Henry Hub prices have continued to surge even as U.S. natural gas production in the Lower 48 states hit a record 109 bcf/d so far in November, up from 107 bcf/d in October. The rise in output typically acts as a bearish factor for prices.

Source: EIA
Over the past six weeks, storage injections have exceeded expectations in five of those weeks.

Source: Investing.com
Additionally, inventories are about 4.2% above the five-year seasonal average (2020–2024).

Source: EIA
While record production and elevated storage levels are weighing on sentiment, strong LNG exports and colder weather forecasts are providing enough support to sustain the recent rally in Henry Hub prices.
Options Skew Signals Caution Now, Optimism Ahead
The front-month November contract shows heavier put positioning, indicating short-term caution.

Source: CME QuikStrike
However, higher call open interest in subsequent contracts suggests that market participants expect Henry Hub prices to strengthen in the months ahead.

Source: CME QuikStrike
Despite the recent price surge, put OI remains concentrated around the USD 3 strike, indicating downside hedging. In contrast, call open interest is higher and more broadly distributed above USD 4.6, suggesting expectations for further upside potential.
Historical Trade Set-up
Winter-driven heating demand, combined with record U.S. LNG exports, provides a firm seasonal tailwind for Henry Hub prices.
Although natural gas prices tend to firm toward year-end, volatility remains high. For example, the January contract (NGF2025) between mid-November 2024 and the end of December, Henry Hub prices rallied but experienced sharp swings.
In 2023, an outright long in the January contract (NGF2024) ultimately finished at a loss by expiration.

Given the CME Henry Hub futures contract size of 10,000 MMBtu, the gross mark-to-market loss for going long on the NGF2024 contract would have been USD 6,080 per contract between 17/Nov/2023 and 27/Dec/2023:
PnL = (3.227 – 2.619) × 10,000 = USD 6,080
To mitigate volatility and hedge, traders often use calendar spreads. Entering one in mid-November 2023 would have generated a gain even though an outright NGF long had declined.

The gross mark-to-market profit on the NGF2024/NGG2024 calendar spread would have been USD 1,300 per contract.

The spread generated a profit because the later-month NGG2024 contract declined more than the front-month NGF2024 contract. In calendar spreads, gains occur whenever the later month lags the front month—either by falling more or rising less.
For Henry Hub, this typically happens when near-term demand or supply conditions keep the front month relatively firmer, allowing the trade to capture month-to-month price differences with lower overall market exposure.
This content is sponsored.
MARKET DATA
CME Real-time Market Data helps identify trading set-ups and express market views better. If you have futures in your trading portfolio, you can check out on CME Group data plans available that suit your trading needs at tradingview.com/cme.
DISCLAIMER
This case study is for educational purposes only and does not constitute investment recommendations or advice. Nor are they used to promote any specific products, or services.
Trading or investment ideas cited here are for illustration only, as an integral part of a case study to demonstrate the fundamental concepts in risk management or trading under the market scenarios being discussed. Please read the FULL DISCLAIMER the link to which is provided in our profile description.
This paper breaks down the key drivers behind the price spike and the market trends that continue to steer Henry Hub futures.
Surging LNG Demand Lifts Henry Hub Futures
The surge in CME Henry Hub futures was driven by strong export demand and record LNG activity. Flows to the eight major U.S. LNG terminals have averaged around 17.8 bcf/d this month, surpassing October’s record (16.7 bcf/d), as global buyers continue to seek U.S. supply.
Source: EIA
According to Reuters (via LSEG data), the U.S. became the first nation to export 10.1 million metric tonnes (mmt) of LNG in a single month in October, up from 9.1 mmt in September.
Europe remained the top destination, taking 6.9 mmt as the region rebuilt inventories ahead of winter and continued to diversify away from Russian gas.
Exports to Asia also climbed, supported by regional growth, energy transition policies, and Taiwan’s phaseout of nuclear power.
The EIA expects U.S. LNG exports to average 14.9 bcf/d this year (25% higher than 2024) and rise another 10% in 2026.
Rising domestic power demand, led by data centres’ soaring electricity use, adds another layer of structural support to gas consumption.
Together, robust export growth and strong power demand create a tighter domestic balance.
Colder Outlook Boosts Natural Gas Sentiment
Colder-than-expected winter forecasts sparked a mid-October rebound in Henry Hub futures as traders unwound shorts after weather models shifted toward stronger heating demand.
NOAA’s 16/Oct seasonal outlook indicated that La Niña conditions are likely to persist through winter, raising the probability of below-average temperatures across northern U.S. states.
These forecasts, while fluid, triggered a repricing of weather risk, with potential production disruptions and pipeline freeze-offs adding to market sensitivity.
The market is now focused on December’s cold risk: near-term demand may soften into Thanksgiving, but structural support and the prospect of a colder December continue to buoy sentiment. Meanwhile, record LNG exports provide a firm floor for Henry Hub prices this winter.
Henry Hub Gained Despite Rising Production and High Storage Levels
Henry Hub prices have continued to surge even as U.S. natural gas production in the Lower 48 states hit a record 109 bcf/d so far in November, up from 107 bcf/d in October. The rise in output typically acts as a bearish factor for prices.
Source: EIA
Over the past six weeks, storage injections have exceeded expectations in five of those weeks.
Source: Investing.com
Additionally, inventories are about 4.2% above the five-year seasonal average (2020–2024).
Source: EIA
While record production and elevated storage levels are weighing on sentiment, strong LNG exports and colder weather forecasts are providing enough support to sustain the recent rally in Henry Hub prices.
Options Skew Signals Caution Now, Optimism Ahead
The front-month November contract shows heavier put positioning, indicating short-term caution.
Source: CME QuikStrike
However, higher call open interest in subsequent contracts suggests that market participants expect Henry Hub prices to strengthen in the months ahead.
Source: CME QuikStrike
Despite the recent price surge, put OI remains concentrated around the USD 3 strike, indicating downside hedging. In contrast, call open interest is higher and more broadly distributed above USD 4.6, suggesting expectations for further upside potential.
Historical Trade Set-up
Winter-driven heating demand, combined with record U.S. LNG exports, provides a firm seasonal tailwind for Henry Hub prices.
Although natural gas prices tend to firm toward year-end, volatility remains high. For example, the January contract (NGF2025) between mid-November 2024 and the end of December, Henry Hub prices rallied but experienced sharp swings.
In 2023, an outright long in the January contract (NGF2024) ultimately finished at a loss by expiration.
Given the CME Henry Hub futures contract size of 10,000 MMBtu, the gross mark-to-market loss for going long on the NGF2024 contract would have been USD 6,080 per contract between 17/Nov/2023 and 27/Dec/2023:
PnL = (3.227 – 2.619) × 10,000 = USD 6,080
To mitigate volatility and hedge, traders often use calendar spreads. Entering one in mid-November 2023 would have generated a gain even though an outright NGF long had declined.
The gross mark-to-market profit on the NGF2024/NGG2024 calendar spread would have been USD 1,300 per contract.
The spread generated a profit because the later-month NGG2024 contract declined more than the front-month NGF2024 contract. In calendar spreads, gains occur whenever the later month lags the front month—either by falling more or rising less.
For Henry Hub, this typically happens when near-term demand or supply conditions keep the front month relatively firmer, allowing the trade to capture month-to-month price differences with lower overall market exposure.
This content is sponsored.
MARKET DATA
CME Real-time Market Data helps identify trading set-ups and express market views better. If you have futures in your trading portfolio, you can check out on CME Group data plans available that suit your trading needs at tradingview.com/cme.
DISCLAIMER
This case study is for educational purposes only and does not constitute investment recommendations or advice. Nor are they used to promote any specific products, or services.
Trading or investment ideas cited here are for illustration only, as an integral part of a case study to demonstrate the fundamental concepts in risk management or trading under the market scenarios being discussed. Please read the FULL DISCLAIMER the link to which is provided in our profile description.
Full Disclaimer - linktr.ee/mintfinance
Disclaimer
The information and publications are not meant to be, and do not constitute, financial, investment, trading, or other types of advice or recommendations supplied or endorsed by TradingView. Read more in the Terms of Use.
Full Disclaimer - linktr.ee/mintfinance
Disclaimer
The information and publications are not meant to be, and do not constitute, financial, investment, trading, or other types of advice or recommendations supplied or endorsed by TradingView. Read more in the Terms of Use.