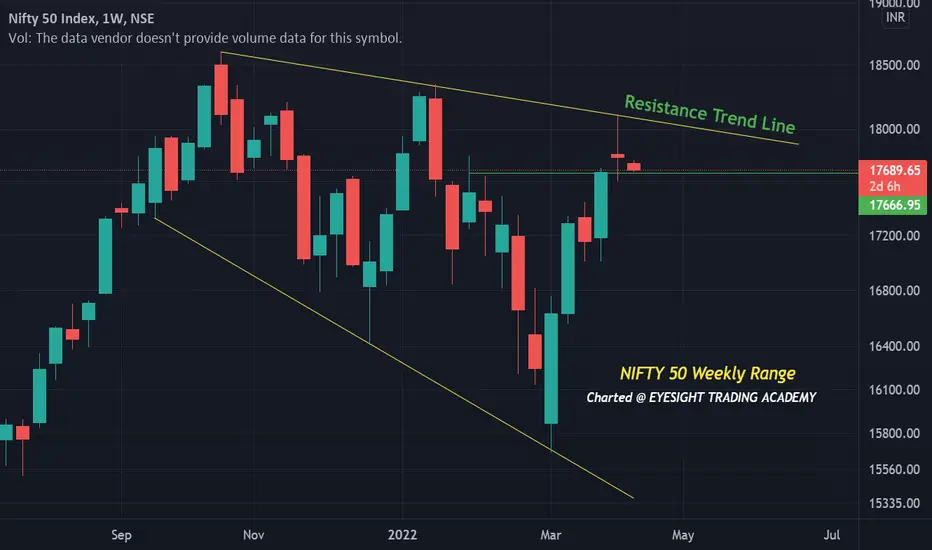
NIFTY Weekly Time Frame Chart looks weak after completion of long doji last week.
Trade active
NIFTY Falls from 17600.00 plus levels to 16400 below levelsDisclaimer
The information and publications are not meant to be, and do not constitute, financial, investment, trading, or other types of advice or recommendations supplied or endorsed by TradingView. Read more in the Terms of Use.
Disclaimer
The information and publications are not meant to be, and do not constitute, financial, investment, trading, or other types of advice or recommendations supplied or endorsed by TradingView. Read more in the Terms of Use.