🔹 NIFTY Trading Plan for 05-Nov-2025
(Based on psychological correction theory & intraday structural behavior)
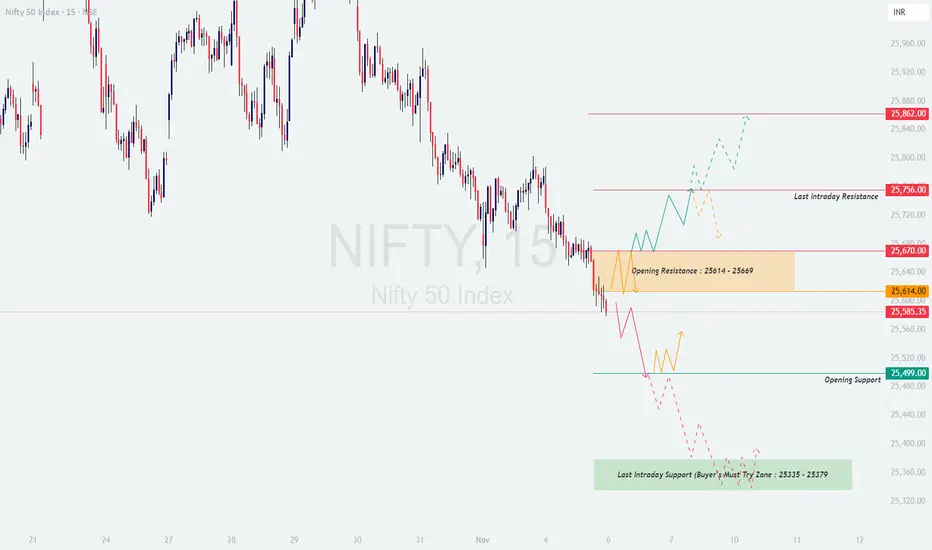
Chart Reference Levels:
🟧 Opening Resistance Zone: 25,614 – 25,669
🟥 Last Intraday Resistance: 25,756
🟩 Opening Support: 25,499
🟢 Last Intraday Support (Buyers’ Must-Try Zone): 25,335 – 25,379
❤️ Upside Extension: 25,862
🟢 Scenario 1: Gap-Up Opening (100+ points above previous close)
📘 Educational Note: Gap-up openings are often emotional reactions to overnight cues. Let the market confirm strength before chasing momentum. Look for stability above key resistance levels before taking directional calls.
🟠 Scenario 2: Flat Opening (±50 points around 25,585)
📘 Educational Note: Flat openings provide the cleanest opportunities for structured intraday setups. Patience during the first 30 minutes helps identify whether smart money is accumulating (bullish bias) or distributing (bearish bias).
🔴 Scenario 3: Gap-Down Opening (100+ points below previous close)
📘 Educational Note: Gap-downs often start with fear-driven selling. Smart traders wait for confirmation candles before entering, as the first impulse frequently fades when institutional players absorb liquidity at lower levels.
💡 Risk Management Tips for Options Traders
📊 Summary & Conclusion:
In summary, 05-Nov-2025 looks like a crucial reaction day — buyers must defend supports, while sellers may try to push the market lower. The best approach is to stay patient for the first half-hour, identify structure, and trade based on confirmation, not assumptions.
⚠️ Disclaimer:
I am not a SEBI-registered analyst. The analysis above is purely for educational and informational purposes. Traders are advised to do their own research or consult a certified financial advisor before making any trading decisions.
(Based on psychological correction theory & intraday structural behavior)
Chart Reference Levels:
🟧 Opening Resistance Zone: 25,614 – 25,669
🟥 Last Intraday Resistance: 25,756
🟩 Opening Support: 25,499
🟢 Last Intraday Support (Buyers’ Must-Try Zone): 25,335 – 25,379
❤️ Upside Extension: 25,862
🟢 Scenario 1: Gap-Up Opening (100+ points above previous close)
- [] If Nifty opens around or above 25,670, it will directly test the Opening Resistance Zone (25,614 – 25,669). Here, traders should observe how the market reacts — a rejection with long upper wicks or high volatility candles could indicate distribution.
[] For bullish continuation, Nifty must sustain above 25,669 with a decisive 15-min candle close. A breakout can invite fresh momentum, pushing the index toward 25,756 and possibly extending up to 25,862. - Failure to hold above 25,669 may trigger a quick pullback to 25,614 or even back to the Opening Support at 25,499, where intraday buyers might reattempt to defend.
📘 Educational Note: Gap-up openings are often emotional reactions to overnight cues. Let the market confirm strength before chasing momentum. Look for stability above key resistance levels before taking directional calls.
🟠 Scenario 2: Flat Opening (±50 points around 25,585)
- [] A flat open near the current zone (25,560–25,600) keeps Nifty in a balancing phase between bulls and bears. This range can act as a decision-making area for the day.
[] Sustained price action above 25,614 will likely attract buying interest, taking prices toward 25,669 – 25,756 levels. - On the downside, if Nifty slips below 25,499, selling pressure can intensify, dragging the index toward 25,379, which is the “Buyers’ Must-Try Zone.”
📘 Educational Note: Flat openings provide the cleanest opportunities for structured intraday setups. Patience during the first 30 minutes helps identify whether smart money is accumulating (bullish bias) or distributing (bearish bias).
🔴 Scenario 3: Gap-Down Opening (100+ points below previous close)
- [] A gap-down below 25,500 directly places the index near the Opening Support or Last Intraday Support zone (25,335 – 25,379).
[] Watch this area carefully — if buyers fail to defend, weakness can extend further. However, a strong reversal candle or volume divergence could trigger short-covering opportunities. - Recovery back above 25,499 would indicate that buyers are attempting to regain control. In that case, a bounce toward 25,614 may unfold, where traders can re-evaluate the next move.
📘 Educational Note: Gap-downs often start with fear-driven selling. Smart traders wait for confirmation candles before entering, as the first impulse frequently fades when institutional players absorb liquidity at lower levels.
💡 Risk Management Tips for Options Traders
- [] Define your maximum risk per trade (1–2% of capital) before entry.
[] Use hourly candle close-based stop losses to avoid false triggers from volatility spikes.
[] Avoid buying far OTM options post 11:00 AM; time decay accelerates rapidly.
[] If volatility (IV) is elevated, consider vertical spreads instead of naked calls or puts. - Always plan both entry and exit before executing — emotions should not decide your stop loss.
📊 Summary & Conclusion:
- [] Above 25,669 → Bullish momentum possible toward 25,756 – 25,862.
[] Between 25,499 – 25,614 → Neutral consolidation; intraday reactions will decide direction. - Below 25,499 → Weakness likely toward 25,379 and 25,335 zones.
In summary, 05-Nov-2025 looks like a crucial reaction day — buyers must defend supports, while sellers may try to push the market lower. The best approach is to stay patient for the first half-hour, identify structure, and trade based on confirmation, not assumptions.
⚠️ Disclaimer:
I am not a SEBI-registered analyst. The analysis above is purely for educational and informational purposes. Traders are advised to do their own research or consult a certified financial advisor before making any trading decisions.
Trade closed: target reached
Disclaimer
The information and publications are not meant to be, and do not constitute, financial, investment, trading, or other types of advice or recommendations supplied or endorsed by TradingView. Read more in the Terms of Use.
Disclaimer
The information and publications are not meant to be, and do not constitute, financial, investment, trading, or other types of advice or recommendations supplied or endorsed by TradingView. Read more in the Terms of Use.