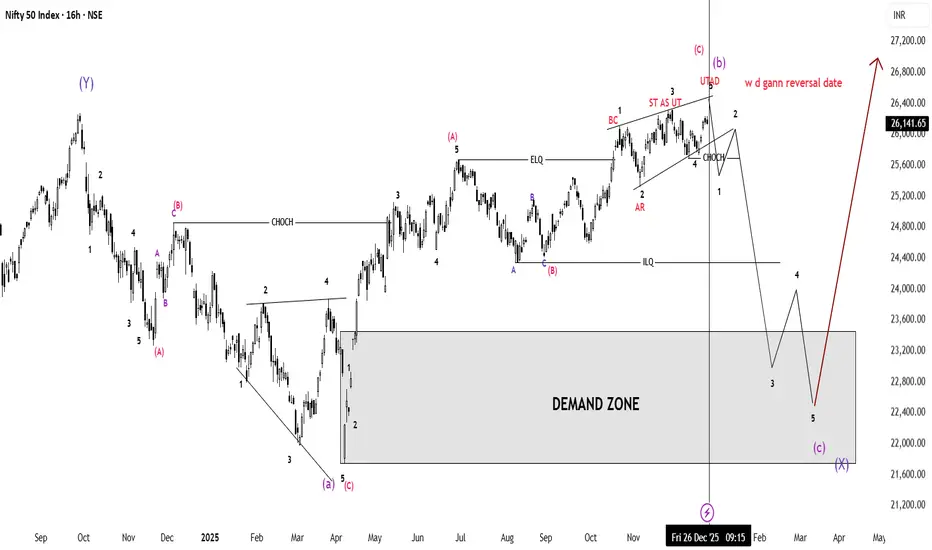
Big picture
NIFTY has completed a strong up-move and is now near a major top / distribution zone.
The chart suggests:
short-term topping → medium-term correction → long-term bullish continuation.
So this is not a crash view, but a healthy correction before the next big rise.
Left side (past structure)
Earlier waves (Y) and (A-B-C) show a completed corrective phase.
A strong rally followed from the large demand zone (grey area).
This confirms institutional buying from lower levels.
Middle section (trend change confirmation)
CHOCH (Change of Character) appears:
Market behavior shifts
Momentum slows
Smart money starts distributing
Price still makes higher highs, but strength is reducing.
Right side (current situation – very important)
🔴 Distribution near the top
BC (Buying Climax) → last aggressive buying
ST as UT (Secondary Test as Upthrust) → price revisits highs but fails
UTAD (Upthrust After Distribution):
Fake breakout above resistance
Traps late buyers
This is a classic Wyckoff distribution pattern.
The vertical line (timing)
Marked as “W.D. Gann reversal date”
This suggests a time-based reversal, not just price-based.
Around this date, trend direction is expected to change.
Expected move (black path)
Small pullback → bounce (to trap buyers)
Breakdown after CHOCH
Sharp fall into the DEMAND ZONE (22,000–23,500 area approx.)
Completion of corrective wave (C) / (X)
Demand Zone (grey box)
This is where:
Big money previously bought
Strong support exists
Expected to act as a major bottom for the correction.
After the correction (red arrow)
Once price stabilizes in the demand zone:
Strong bullish reversal expected
Start of a new impulsive uptrend
Target shows new all-time highs over the coming months.
Simple summary (no jargon)
📈 Market has gone up a lot
⚠️ Now topping and trapping late buyers
📉 Expect a deep but controlled correction
🧠 Smart money likely buys again at lower levels
🚀 Bigger rally comes after the correction
In one line:
Short-term bearish, medium-term corrective, long-term bullish.
Disclaimer
The information and publications are not meant to be, and do not constitute, financial, investment, trading, or other types of advice or recommendations supplied or endorsed by TradingView. Read more in the Terms of Use.
Disclaimer
The information and publications are not meant to be, and do not constitute, financial, investment, trading, or other types of advice or recommendations supplied or endorsed by TradingView. Read more in the Terms of Use.