Hello, fellow traders!
Follow me to get the latest information quickly.
Have a great day.
-------------------------------------
To understand the charts, the basic trading strategy is the concept used.
Let's look at an example.
---------------------------------------------------------
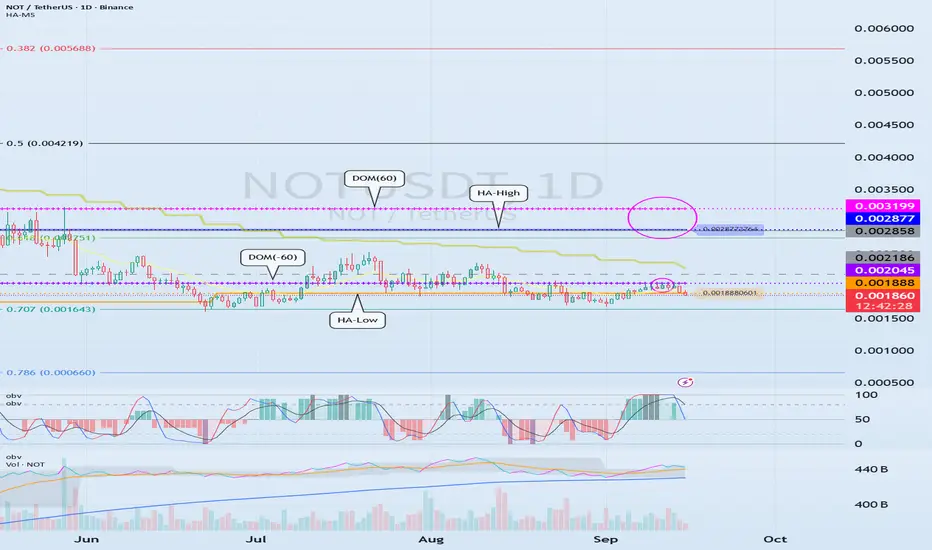
The OBV indicator, which follows the Low Line ~ High Line channel, has shown an upward trend as it has broken above EMA 1 and EMA 2.
Afterwards, the DOM(60) and HA-High indicators were formed, ultimately returning the price to its original position.
Since the HA-Low indicator is forming at 0.001888, we need to examine whether it can find support and rise around this level.
In other words, a buy signal is in the 0.001888-0.002045 range, where support is found and the price rises.
Since the HA-Low and HA-High indicators have converged, a sharp rise is expected if the sideways movement ends and the price rises above 0.002877-0.003199.
-
The basic trading strategy is based on the HA-Low and HA-High indicators, indicators developed for trading on Heikin-Ashi charts.
The basic trading strategy is to buy in the DOM(-60) to HA-Low range and sell in the HA-High to DOM(60) range.
However, if the price rises from the HA-High to DOM(60) range, a step-like upward trend is likely, while if it falls from the DOM(-60) to HA-Low range, a step-like downward trend is likely.
Therefore, the basic trading strategy should be a segmented trading approach.
Therefore, rather than predicting trends based on the movements of one or two indicators, you should prioritize developing a basic trading strategy.
-
If the HA-Low indicator touches and rises to meet the HA-High indicator, the wave should be considered closed.
Furthermore, if the HA-High indicator touches and falls to meet the HA-Low indicator, the wave should also be considered closed.
Remember that the closing of these waves serves as a benchmark for creating new trading strategies.
Previous waves should be forgotten and new trading strategies developed.
-
Thank you for reading to the end.
I wish you successful trading.
--------------------------------------------------
Note
#TRXUSDTThis wave has closed with the formation of the DOM(-60) and HA-Low indicators.
Therefore, a new wave will be created depending on the direction of the breakout from the 0.3145-0.3361 and 0.3563-0.3575 ranges.
We should monitor the movements of the OBV indicator, the TC (Trend Check) indicator, and the StochRSI indicator within the Low Line and High Line channels to determine whether support exists within the support and resistance zones.
※ Follow X to check out the posts.
※ X를 팔로우하고 게시물을 확인하세요.
◆ t.me/readCryptoChannel
[HA-MS Indicator]
bit.ly/3YxHgvN
[OBV Indicator]
bit.ly/4dcyny3
※ X를 팔로우하고 게시물을 확인하세요.
◆ t.me/readCryptoChannel
[HA-MS Indicator]
bit.ly/3YxHgvN
[OBV Indicator]
bit.ly/4dcyny3
Disclaimer
The information and publications are not meant to be, and do not constitute, financial, investment, trading, or other types of advice or recommendations supplied or endorsed by TradingView. Read more in the Terms of Use.