Elliott Wave Interpretation of PFC chart.
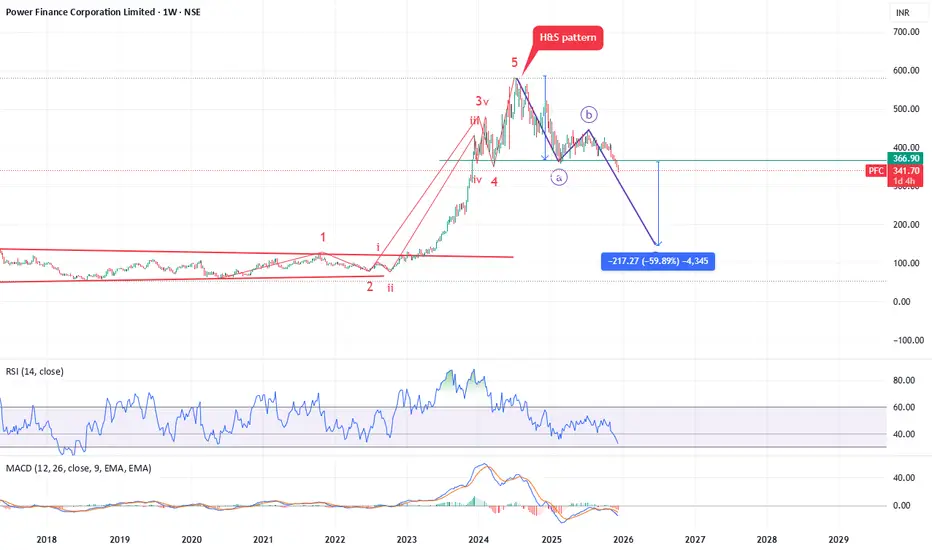
Your chart shows a full 5-wave impulse completed on the weekly timeframe:
Wave 1 → 2 → 3 → 4 → 5 completed around mid-2024
Wave 5 shows exhaustion + RSI divergence → confirms top
A Head & Shoulders pattern formed near the Wave 5 top
After completion of the impulse, market entered a corrective ABC phase
Probability of ABC returning to Wave 1 region
✔ Because the prior 5 waves were extremely extended,
✔ and because the top created a Head & Shoulders reversal
Tentative Target for the ABC Pattern (Wave C Target)
🎯 ₹130 – ₹160 (High probability)
🎯 ₹100 – ₹130 (If selling accelerates)
Disclaimer
The information and publications are not meant to be, and do not constitute, financial, investment, trading, or other types of advice or recommendations supplied or endorsed by TradingView. Read more in the Terms of Use.
Disclaimer
The information and publications are not meant to be, and do not constitute, financial, investment, trading, or other types of advice or recommendations supplied or endorsed by TradingView. Read more in the Terms of Use.