Is Procter & Gamble Setting Up for a Strong Bullish Reversal?
🚨 P&G Bullish Master Plan: Steal Profits with the Thief Strategy! 🤑
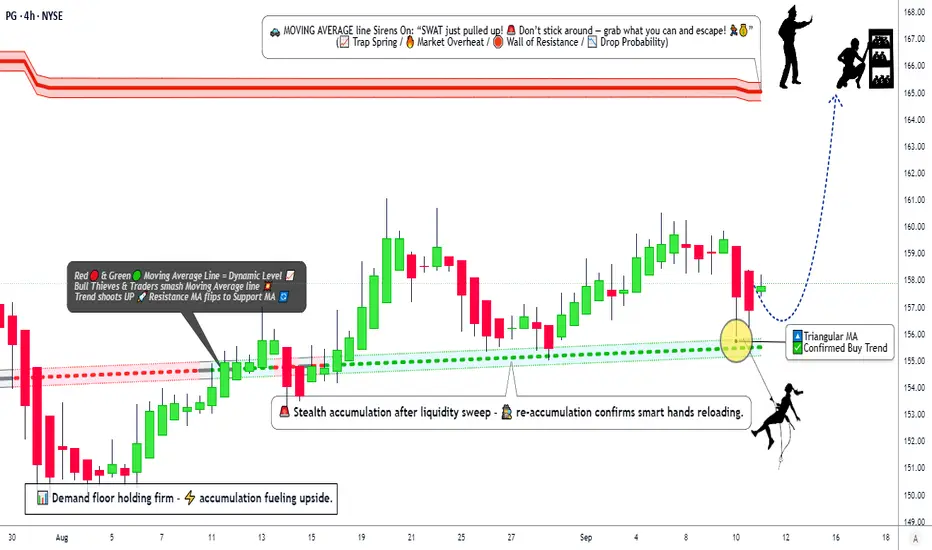
📊 Asset: Procter & Gamble (PG) – Swing/Day Trade Setup📈 Date: September 11, 2025🎯 Plan: Bullish Triangular Moving Average Pullback – Confirm the Buy Trend!
🕵️♂️ Why the Thief Strategy for PG?
The Thief Strategy is a clever, layered limit-order approach designed to capitalize on PG’s bullish momentum while navigating market traps. Backed by technical signals, solid fundamentals, and a cautious market sentiment, this plan aims to sneak in profits before the “police barricade” (resistance) stops the rally.
Here’s why PG is ripe for a steal:
Technical Edge 🧠: PG’s price action shows a bullish pullback within a triangular moving average setup, signaling a continuation of the buy trend.
Fundamental Strength 💪: PG’s robust balance sheet and consistent dividends make it a defensive powerhouse, even in uncertain markets.
Market Sentiment 😊: Retail traders are bullish, while institutions remain cautious, creating a contrarian opportunity for savvy thieves.
Fear & Greed Index 😨: At 39 (Fear), the market’s caution suggests undervaluation, a prime setup for a bullish swing.
📈 PG Stock Snapshot – September 11, 2025
💰 Price Overview
Daily Range: $157.05 - $158.18
Previous Close: $157.35
Market Cap: $372.16B
Yearly Range: $149.91 - $180.43
😊 Investor Sentiment
Retail Traders: 51.6% Bullish 🟢 (Positive buying momentum)
Institutional Traders: 49.3% Bearish 🔴 (Cautious, mixed outflows)
Overall Mood: Neutral, leaning slightly bearish due to institutional caution
😨 Fear & Greed Index
Current Level: 39 (Fear) 😟
Insight: Indicates cautious market sentiment, with fear slightly dominating greed, suggesting potential undervaluation for contrarian traders.
📈 Fundamental Score: 7.6/10 ✅
Strengths: Strong liquidity, operational efficiency, and reliable dividends.
Concerns: Inventory turnover (60.62 days), negative cash flow growth (-8.77% YoY).
🌍 Macro Score: 6.8/10 ⚖️
Tailwinds: Stable consumer goods demand supports growth.
Headwinds: Tariff policies and geopolitical tensions may pressure global sales. Fed’s steady rates (4.25%-4.50%) could squeeze margins.
🐂🐻 Market Outlook: Neutral (Hold) ⚖️
Bull Case: Strong fundamentals, retail buying, and dividend reliability support long-term stability 🟢.
Bear Case: Institutional outflows and macro uncertainties suggest short-term caution 🔴.
🎯 Key Takeaway: PG is a solid long-term investment with strong fundamentals, but short-term caution is advised due to mixed sentiment and macro risks. Monitor upcoming earnings and tariff developments. 🚨
🕵️♂️ Thief Strategy: Bullish Plan for PG
Plan Overview: Use a layered limit-order strategy to “steal” profits on PG’s bullish pullback within a triangular moving average setup. This approach maximizes entries while managing risk in a volatile market.
📥 Entry:
Layered Limit Orders: Place multiple buy limit orders at $156.00, $157.00, $158.00, and $159.00 to capitalize on pullbacks.
Flexibility: Adjust layers based on your risk tolerance and market conditions. Choose any price level within the $156–$159 accumulation zone for entry.
Why? The triangular moving average pullback confirms bullish momentum, with support at $156–$159 aligning with Fibonacci clusters and institutional buying zones.
🛑 Stop Loss:
Thief SL: Set at $154.00 to protect against a breakdown below key support.
Note: Adjust your stop loss based on your risk tolerance and strategy. The $154 level is a suggestion, not a mandate—manage your risk wisely, Thief OGs!
🎯 Target:
Primary Target: $165.00 (strong resistance zone).
Why? $165 aligns with the first resistance level and overbought conditions, where a “trap police barricade” may halt the rally. Take profits early to escape with your stolen gains!
Note: Set your own take-profit levels based on your strategy. Don’t blindly follow the $165 target—secure profits at your discretion.
⚠️ Risk Management:
Use tight risk management with layered entries to average into positions.
Consider partial profit-taking at $160 and $165, holding runners for $172 if momentum sustains.
Monitor macro developments (e.g., tariffs, Fed policy) for potential volatility.
🔍 Technical Breakdown: Why Bullish?
Triangular Moving Average: PG’s price is respecting a bullish TMA structure, with a recent pullback confirming support at $156–$159.
Fibonacci Alignment: The $156–$159 zone aligns with a key Fibonacci cluster, reinforcing the buy zone.
Momentum Indicators: Stochastic RSI is in the bullish zone, and Rate of Change (ROC) shows increasing buying interest.
Institutional Confluence: Institutional models signal a buy with a $159.98 target, supported by technical exhaustion of the recent correction.
🧠 Why This Plan Works?
Technical Precision 🎯: The TMA pullback and Fibonacci confluence provide a high-probability setup for a bullish swing.
Sentiment Edge 😊: Retail bullishness (51.6%) contrasts with institutional caution (49.3% bearish), creating a contrarian opportunity for short-term gains.
Fundamental Backbone 💪: PG’s 7.6/10 fundamental score highlights its resilience as a consumer staple, ideal for defensive plays.
Macro Awareness 🌍: Despite tariff risks, stable consumer demand supports PG’s long-term stability, making it a safe bet for swing/day trades.
Fear & Greed Advantage 😨: A Fear reading of 39 suggests undervaluation, aligning with Warren Buffett’s “be greedy when others are fearful” philosophy.
💸 Related Pairs to Watch ( USD)
USD)
Monitor these pairs for correlated market moves:
 XLP (Consumer Staples Select Sector SPDR Fund): Tracks consumer staples like PG. Bullish XLP supports PG’s upside.
 KO (Coca-Cola): Another defensive staple with similar market dynamics.
 WMT (Walmart): Retail giant tied to consumer goods demand.
 GLD (Gold): Safe-haven asset for macro risk hedging.
✨ “If you find value in my analysis, a 👍 and 🚀 boost is much appreciated — it helps me share more setups with the community!”
#TradingView #PG #Bullish #ThiefStrategy #SwingTrading #DayTrading #TechnicalAnalysis #FearAndGreed #ConsumerStaples #StockMarket
⚠️ Disclaimer
This analysis is for educational purposes only and does not constitute financial advice. Trading involves risk, and past performance does not guarantee future results. Always conduct your own research and manage risk according to your financial circumstances.
📊 Asset: Procter & Gamble (PG) – Swing/Day Trade Setup📈 Date: September 11, 2025🎯 Plan: Bullish Triangular Moving Average Pullback – Confirm the Buy Trend!
🕵️♂️ Why the Thief Strategy for PG?
The Thief Strategy is a clever, layered limit-order approach designed to capitalize on PG’s bullish momentum while navigating market traps. Backed by technical signals, solid fundamentals, and a cautious market sentiment, this plan aims to sneak in profits before the “police barricade” (resistance) stops the rally.
Here’s why PG is ripe for a steal:
Technical Edge 🧠: PG’s price action shows a bullish pullback within a triangular moving average setup, signaling a continuation of the buy trend.
Fundamental Strength 💪: PG’s robust balance sheet and consistent dividends make it a defensive powerhouse, even in uncertain markets.
Market Sentiment 😊: Retail traders are bullish, while institutions remain cautious, creating a contrarian opportunity for savvy thieves.
Fear & Greed Index 😨: At 39 (Fear), the market’s caution suggests undervaluation, a prime setup for a bullish swing.
📈 PG Stock Snapshot – September 11, 2025
💰 Price Overview
Daily Range: $157.05 - $158.18
Previous Close: $157.35
Market Cap: $372.16B
Yearly Range: $149.91 - $180.43
😊 Investor Sentiment
Retail Traders: 51.6% Bullish 🟢 (Positive buying momentum)
Institutional Traders: 49.3% Bearish 🔴 (Cautious, mixed outflows)
Overall Mood: Neutral, leaning slightly bearish due to institutional caution
😨 Fear & Greed Index
Current Level: 39 (Fear) 😟
Insight: Indicates cautious market sentiment, with fear slightly dominating greed, suggesting potential undervaluation for contrarian traders.
📈 Fundamental Score: 7.6/10 ✅
Strengths: Strong liquidity, operational efficiency, and reliable dividends.
Concerns: Inventory turnover (60.62 days), negative cash flow growth (-8.77% YoY).
🌍 Macro Score: 6.8/10 ⚖️
Tailwinds: Stable consumer goods demand supports growth.
Headwinds: Tariff policies and geopolitical tensions may pressure global sales. Fed’s steady rates (4.25%-4.50%) could squeeze margins.
🐂🐻 Market Outlook: Neutral (Hold) ⚖️
Bull Case: Strong fundamentals, retail buying, and dividend reliability support long-term stability 🟢.
Bear Case: Institutional outflows and macro uncertainties suggest short-term caution 🔴.
🎯 Key Takeaway: PG is a solid long-term investment with strong fundamentals, but short-term caution is advised due to mixed sentiment and macro risks. Monitor upcoming earnings and tariff developments. 🚨
🕵️♂️ Thief Strategy: Bullish Plan for PG
Plan Overview: Use a layered limit-order strategy to “steal” profits on PG’s bullish pullback within a triangular moving average setup. This approach maximizes entries while managing risk in a volatile market.
📥 Entry:
Layered Limit Orders: Place multiple buy limit orders at $156.00, $157.00, $158.00, and $159.00 to capitalize on pullbacks.
Flexibility: Adjust layers based on your risk tolerance and market conditions. Choose any price level within the $156–$159 accumulation zone for entry.
Why? The triangular moving average pullback confirms bullish momentum, with support at $156–$159 aligning with Fibonacci clusters and institutional buying zones.
🛑 Stop Loss:
Thief SL: Set at $154.00 to protect against a breakdown below key support.
Note: Adjust your stop loss based on your risk tolerance and strategy. The $154 level is a suggestion, not a mandate—manage your risk wisely, Thief OGs!
🎯 Target:
Primary Target: $165.00 (strong resistance zone).
Why? $165 aligns with the first resistance level and overbought conditions, where a “trap police barricade” may halt the rally. Take profits early to escape with your stolen gains!
Note: Set your own take-profit levels based on your strategy. Don’t blindly follow the $165 target—secure profits at your discretion.
⚠️ Risk Management:
Use tight risk management with layered entries to average into positions.
Consider partial profit-taking at $160 and $165, holding runners for $172 if momentum sustains.
Monitor macro developments (e.g., tariffs, Fed policy) for potential volatility.
🔍 Technical Breakdown: Why Bullish?
Triangular Moving Average: PG’s price is respecting a bullish TMA structure, with a recent pullback confirming support at $156–$159.
Fibonacci Alignment: The $156–$159 zone aligns with a key Fibonacci cluster, reinforcing the buy zone.
Momentum Indicators: Stochastic RSI is in the bullish zone, and Rate of Change (ROC) shows increasing buying interest.
Institutional Confluence: Institutional models signal a buy with a $159.98 target, supported by technical exhaustion of the recent correction.
🧠 Why This Plan Works?
Technical Precision 🎯: The TMA pullback and Fibonacci confluence provide a high-probability setup for a bullish swing.
Sentiment Edge 😊: Retail bullishness (51.6%) contrasts with institutional caution (49.3% bearish), creating a contrarian opportunity for short-term gains.
Fundamental Backbone 💪: PG’s 7.6/10 fundamental score highlights its resilience as a consumer staple, ideal for defensive plays.
Macro Awareness 🌍: Despite tariff risks, stable consumer demand supports PG’s long-term stability, making it a safe bet for swing/day trades.
Fear & Greed Advantage 😨: A Fear reading of 39 suggests undervaluation, aligning with Warren Buffett’s “be greedy when others are fearful” philosophy.
💸 Related Pairs to Watch (
Monitor these pairs for correlated market moves:
✨ “If you find value in my analysis, a 👍 and 🚀 boost is much appreciated — it helps me share more setups with the community!”
#TradingView #PG #Bullish #ThiefStrategy #SwingTrading #DayTrading #TechnicalAnalysis #FearAndGreed #ConsumerStaples #StockMarket
⚠️ Disclaimer
This analysis is for educational purposes only and does not constitute financial advice. Trading involves risk, and past performance does not guarantee future results. Always conduct your own research and manage risk according to your financial circumstances.
Trade closed manually
💰 Money-Making Analysis
• Forex💹
• Indices📈
• Crypto ₿
• Commodities⚡
• Stocks🏦
• Fundamental + Macro📊
• Sentiment🔎
👉 Ask what analysis you need & get it FREE!
Join Discord for signals + data & grab the Master Plan: discord.gg/ZQS3y7FhVr
• Forex💹
• Indices📈
• Crypto ₿
• Commodities⚡
• Stocks🏦
• Fundamental + Macro📊
• Sentiment🔎
👉 Ask what analysis you need & get it FREE!
Join Discord for signals + data & grab the Master Plan: discord.gg/ZQS3y7FhVr
Related publications
Disclaimer
The information and publications are not meant to be, and do not constitute, financial, investment, trading, or other types of advice or recommendations supplied or endorsed by TradingView. Read more in the Terms of Use.