This analysis combines  PGNY both fundamental and technical perspectives.
Fundamental View

From a fundamental standpoint, PGNY looks weak and potentially overvalued.
1. EPS and profitability
EPS remains unstable. After reaching break even around 2021, it has been fluctuating between 0.4 and 0.6. There is no clear EPS growth trend, which puts pressure on the valuation.
2. Revenue growth
Revenue growth used to be strong at 40 to 50 percent per year.
Over the past year growth has slowed dramatically to about 7 percent.
The expected quarterly growth is around 10 percent which is still far below historical levels.
3. Forward P E
The forward P E is around 44 which is expensive given the current fundamentals.
4. Cash flow and capital structure
Cash flow has been flat since 2024.
The liquidity cushion is small at about 190 million and not growing.
The company executed a small buyback from May to December 2024 but is now slightly diluting shares by 0.3 to 0.6 percent.
Fundamental conclusion:
The stock looks overpriced. Growth is slowing and EPS is not improving while valuation remains high.
Technical View
Technical analysis gives a much more bullish picture.
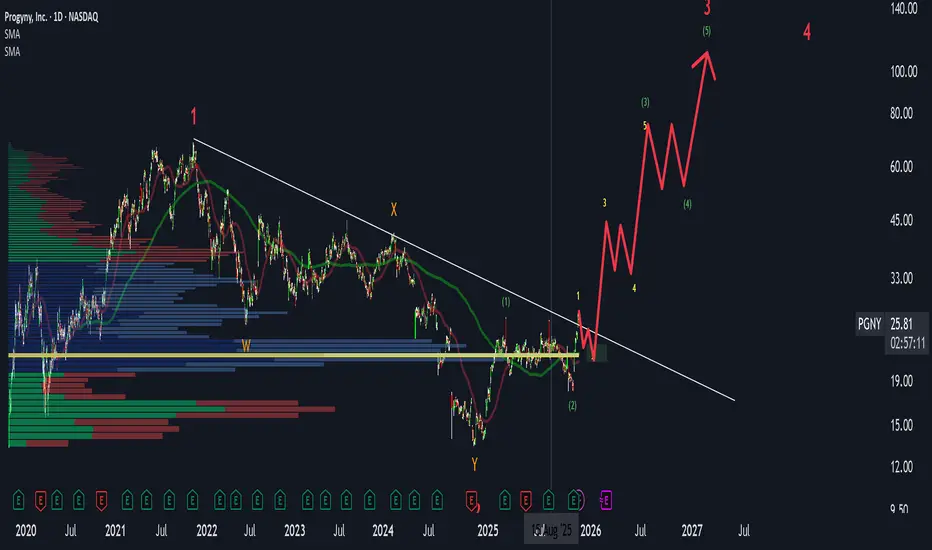
1. Completion of a large Wave Two
Price appears to have completed a W X Y corrective structure.
The important OX trendline has been broken which is a strong bullish signal.
2. Local wave structure

A clear first and second wave have formed to the upside.
The trendline breakout was confirmed by a candle with increased volume.
Usually after such a breakout price retests the line from above and continues higher.
Expected movement:
3. Volume profile

Price is currently sitting at the lower boundary of the major volume cluster between 20 and 25 dollars.
This area is strong support where reversals often occur.
Gaps and Risks
There are several important gaps that may influence the price action.
1. Gap at 18 to 19 dollars
Price may attempt to fill this gap.
It would be a sharp correction but it is possible.
My stop loss is set at 18 dollars. A breakdown below this level destroys the current bullish structure.
2. Gap near 15 dollars
This gap has never been closed.
Fundamentally the company is weak so the scenario of a deeper correction is not impossible.
However the most likely scenario still suggests that this gap may remain open.
My Position
I currently hold PGNY in my portfolio.
My entry price is 16.40 dollars.
My stop loss is set at 18 dollars which is the level that would invalidate my bullish structure.
Summary
PGNY is in a mixed position.
Risks remain due to the open gaps at 18 to 19 and 15. A breakdown below 18 would signal a bearish reversal.
Fundamental View
From a fundamental standpoint, PGNY looks weak and potentially overvalued.
1. EPS and profitability
EPS remains unstable. After reaching break even around 2021, it has been fluctuating between 0.4 and 0.6. There is no clear EPS growth trend, which puts pressure on the valuation.
2. Revenue growth
Revenue growth used to be strong at 40 to 50 percent per year.
Over the past year growth has slowed dramatically to about 7 percent.
The expected quarterly growth is around 10 percent which is still far below historical levels.
3. Forward P E
The forward P E is around 44 which is expensive given the current fundamentals.
4. Cash flow and capital structure
Cash flow has been flat since 2024.
The liquidity cushion is small at about 190 million and not growing.
The company executed a small buyback from May to December 2024 but is now slightly diluting shares by 0.3 to 0.6 percent.
Fundamental conclusion:
The stock looks overpriced. Growth is slowing and EPS is not improving while valuation remains high.
Technical View
Technical analysis gives a much more bullish picture.
1. Completion of a large Wave Two
Price appears to have completed a W X Y corrective structure.
The important OX trendline has been broken which is a strong bullish signal.
2. Local wave structure
A clear first and second wave have formed to the upside.
The trendline breakout was confirmed by a candle with increased volume.
Usually after such a breakout price retests the line from above and continues higher.
Expected movement:
- potential retest near 20
- after that a move toward 45
- above 45 the next technical target is around 68
3. Volume profile
Price is currently sitting at the lower boundary of the major volume cluster between 20 and 25 dollars.
This area is strong support where reversals often occur.
Gaps and Risks
There are several important gaps that may influence the price action.
1. Gap at 18 to 19 dollars
Price may attempt to fill this gap.
It would be a sharp correction but it is possible.
My stop loss is set at 18 dollars. A breakdown below this level destroys the current bullish structure.
2. Gap near 15 dollars
This gap has never been closed.
Fundamentally the company is weak so the scenario of a deeper correction is not impossible.
However the most likely scenario still suggests that this gap may remain open.
My Position
I currently hold PGNY in my portfolio.
My entry price is 16.40 dollars.
My stop loss is set at 18 dollars which is the level that would invalidate my bullish structure.
Summary
PGNY is in a mixed position.
- Fundamentals are weak and valuation looks elevated.
- Technicals are bullish with a trendline breakout supported by volume.
- Short term price movement will likely include a correction toward 20 to 21.
- A dip to 19 to close the gap is possible before any move higher.
- If the technical setup holds targets are 45 and then 68.
Risks remain due to the open gaps at 18 to 19 and 15. A breakdown below 18 would signal a bearish reversal.
📈 Stock forecasts & real-time market discussion
💬 Join my trading hub →discord.gg/yEdj6kVA
💬 Join my trading hub →discord.gg/yEdj6kVA
Related publications
Disclaimer
The information and publications are not meant to be, and do not constitute, financial, investment, trading, or other types of advice or recommendations supplied or endorsed by TradingView. Read more in the Terms of Use.