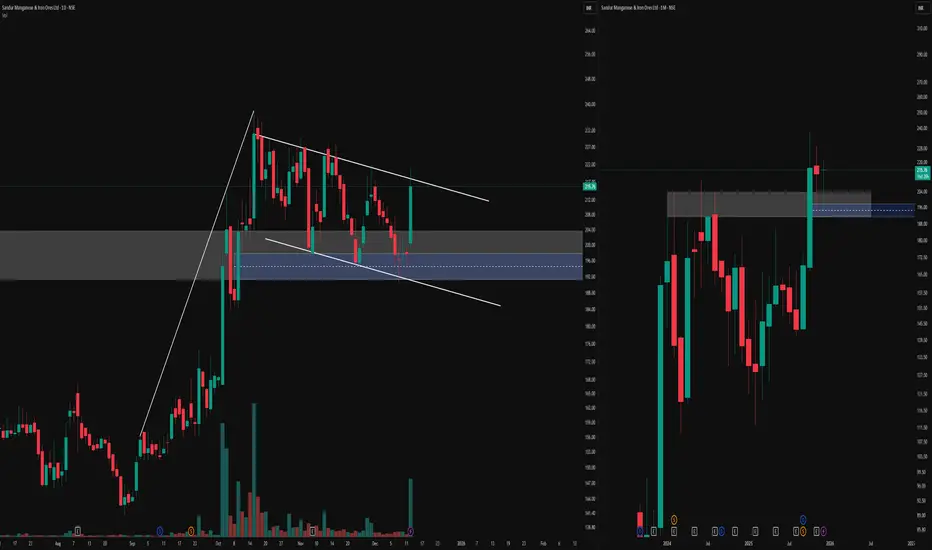
On the left, the daily timeframe is highlighting a potential flag‑and‑pole structure after a strong one‑sided move.
Within this leg, a blue fair value gap has been marked, which price has interacted with multiple times, illustrating how an imbalanced area can act as a reference zone over time.
On the right, the monthly timeframe of the same instrument is added to provide broader structural context to the daily pattern.
This multi‑timeframe layout is meant purely to show how a lower‑timeframe pattern and an identified fair value gap can be viewed alongside the higher‑timeframe trend without attaching any directional bias.
Disclaimer: This post is for educational and illustrative purposes only and does not constitute investment, trading, or financial advice. Always do your own research and consult a registered financial professional before making any trading decisions.
🎯 Master My Self-Made Trading Strategy
📈 Telegram (Learn Today): t.me/hashtaghammer
✅ WhatsApp (Learn Today): wa.me/919455664601
📈 Telegram (Learn Today): t.me/hashtaghammer
✅ WhatsApp (Learn Today): wa.me/919455664601
Related publications
Disclaimer
The information and publications are not meant to be, and do not constitute, financial, investment, trading, or other types of advice or recommendations supplied or endorsed by TradingView. Read more in the Terms of Use.