📍 Pivot / Support / Resistance Levels (1-day)
From the data available:
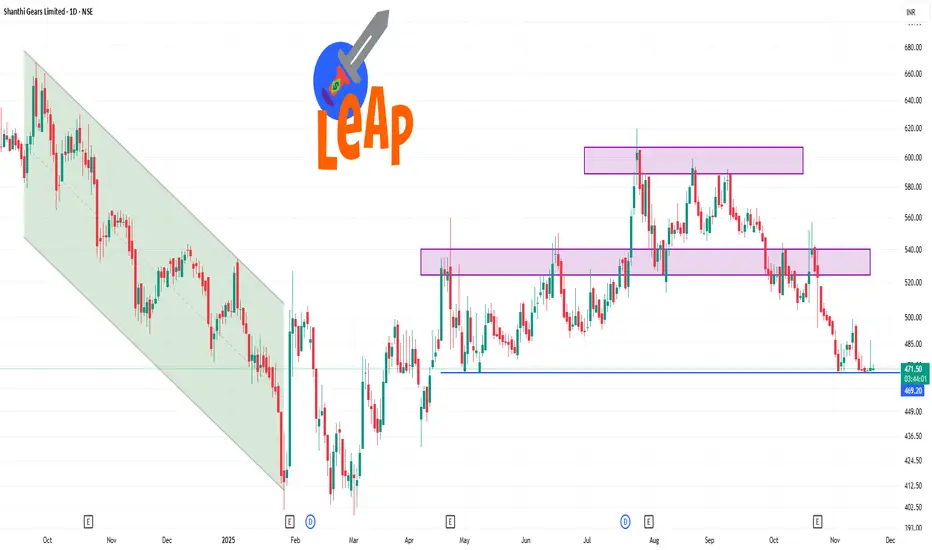
Pivot point (classic) ~ ₹ 471.35.
Resistance levels: R1 ~ ₹ 472.65, R2 ~ ₹ 474.30, R3 ~ ₹ 475.60 (classic)
Support levels: S1 ~ ₹ 469.70, S2 ~ ₹ 468.40, S3 ~ ₹ 466.75 (classic)
Bollinger lower band ~ ₹ 475.62, upper band ~ ₹ 547.04 (20-day)
🔍 My Interpretation
Given the indicators and levels:
The stock is under selling pressure in the short term; trend favors the downside.
Primary resistance is around ₹ 472-475 range. If the price moves up, it may struggle to clear that.
Primary supports around ₹ 466-469 zone. A break below this zone could open for further downside.
Because RSI is near oversold, there could be a short-term bounce, but unless the trend changes (moving averages turn up, price breaks above resistance), any bounce may remain limited.
From the data available:
Pivot point (classic) ~ ₹ 471.35.
Resistance levels: R1 ~ ₹ 472.65, R2 ~ ₹ 474.30, R3 ~ ₹ 475.60 (classic)
Support levels: S1 ~ ₹ 469.70, S2 ~ ₹ 468.40, S3 ~ ₹ 466.75 (classic)
Bollinger lower band ~ ₹ 475.62, upper band ~ ₹ 547.04 (20-day)
🔍 My Interpretation
Given the indicators and levels:
The stock is under selling pressure in the short term; trend favors the downside.
Primary resistance is around ₹ 472-475 range. If the price moves up, it may struggle to clear that.
Primary supports around ₹ 466-469 zone. A break below this zone could open for further downside.
Because RSI is near oversold, there could be a short-term bounce, but unless the trend changes (moving averages turn up, price breaks above resistance), any bounce may remain limited.
Related publications
Disclaimer
The information and publications are not meant to be, and do not constitute, financial, investment, trading, or other types of advice or recommendations supplied or endorsed by TradingView. Read more in the Terms of Use.
Related publications
Disclaimer
The information and publications are not meant to be, and do not constitute, financial, investment, trading, or other types of advice or recommendations supplied or endorsed by TradingView. Read more in the Terms of Use.