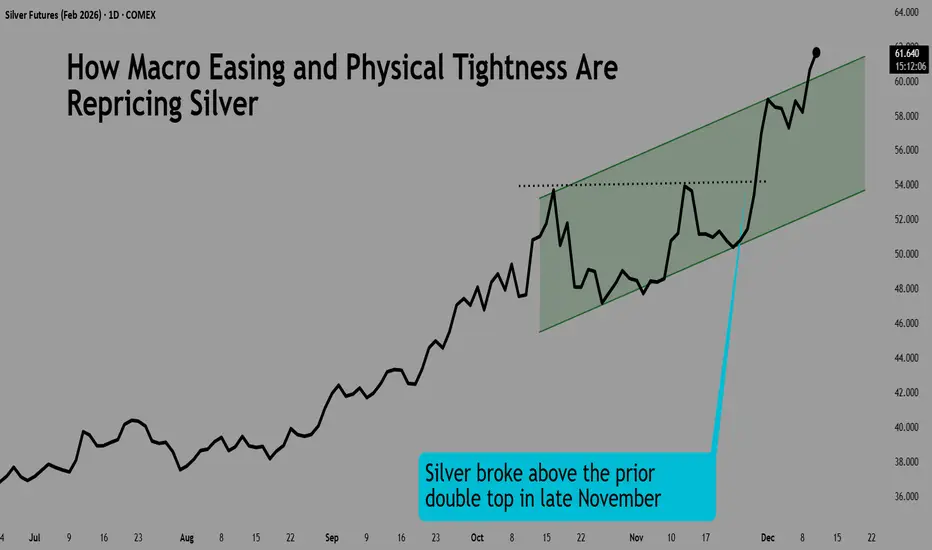
Silver prices have surged to unprecedented highs as 2025 draws to a close. In early December, silver pushed above USD 58 per ounce, marking a nominal all-time high (surpassing the 1980 and 2011 peaks) and nearly doubling in value from the start of the year.
This extraordinary rally underscores silver’s dual nature as both an industrial commodity and a safe-haven asset, driven by a perfect storm of robust demand, persistent supply deficits, and supportive macroeconomic conditions.
Macroeconomic Shifts and a Softer U.S. Dollar
Monetary policy tailwinds have bolstered silver’s ascent.
After keeping interest rates at a restrictive high throughout most of 2025, the Federal Reserve began easing with a 25 bps rate cut in October, and markets widely anticipate another cut at the upcoming December 9–10 meeting.
CME FedWatch shows 86% odds of a December rate reduction as against last month’s 69% probability, following recent weak jobs data, with jobless claims diving to a multi-year low. Analysts believe private investors increased allocations after those cuts, considering silver a higher-beta alternative to gold.

Source: CME FedWatch
ADP’s private data showed a drop of 32,000 roles in November, with wage growth also on a downward trend.
The prospect of Fed easing has weakened the U.S. dollar and lowered bond yields, enhancing the appeal of non-yielding assets like silver.

Earlier this year, traders rushed massive volumes of silver into U.S. vaults earlier in order to avoid tariffs, and while this temporarily ballooned U.S. inventories, it drained liquidity from overseas markets and stoked fears of shortages.
This time around, tariffs risk has increased owing to silver being included in the critical minerals list, making fear an additional driver along with macro dynamics, even as industrial demand is not growing as fast.
Physical Market Tightness and Industrial Demand
Silver’s recent price surge is being driven by an exceptionally tight physical market. Global demand is again set to outpace supply in 2025, marking the fifth consecutive year of deficit. Even with mine output holding steady, the Silver Institute projects a 95-million-ounce shortfall, bringing the cumulative deficit since 2021 to nearly 820 million ounces.
By October, London, the world’s main physical trading hub, saw heavy drawdowns in vault stockpiles as metal was shipped out to meet surging U.S. and Indian demand, leading to a collapse in free-float inventory. Silver lease rates in London spiked above 11%, an extraordinarily high level, reflecting the urgency to obtain physical metal.
Meanwhile, a geographic dislocation emerged. So much silver was shipped into U.S. COMEX warehouses this year (ahead of tariffs) that record inventories accumulated – over 530 million ounces by October.

Source: DataTrack
Since then, with tariff risks alleviated, the metal began shifting to London again, seeing as the spot there was now higher than in the United States as of 04/Dec, COMEX inventories are back to mid-March levels.
Crucially, industrial demand remains a strong pillar beneath the silver market, even if it isn’t growing all that fast. Even though high prices have prompted some thrifting, where less silver is used per device, total industrial usage is still projected to reach roughly 665 million ounces in 2025, 2% below last year’s record.
Green technologies continue to be a major silver driver. For perspective, solar energy alone likely accounted for on the order of 200 Moz of silver demand in 2024, and global EV manufacturing is estimated to add another 90 Moz in 2025. With new mining projects projected to add only about 44 Moz of additional annual supply over the next 5-10 years, these industrial needs ensure that any demand surge hits a supply wall.
While current industrial growth numbers may not look promising, it is more about the inelasticity of demand, which is still being met with persistent deficits. With investor buying on the rise, the chances of supply hiccups only increase.
Investor Flows and Market Positioning Favour Further Gains
By early November, global silver ETP holdings had swollen by roughly 18% YTD, putting total holdings near all-time highs. Importantly, about half of these ETP holdings are stored in London, meaning a large portion of the world’s investment silver became effectively tied up in vaults.
Physical investment demand is robust as well. India, the world’s largest silver importer, saw buoyant buying even at record rupee prices, with continued accumulation of silver on price dips.
The iShares SLV ETF netted inflows of USD 1,227.6 million over the past 3 months.

After starting the year above 100:1, the gold: silver ratio fell to sub-72 by December, the lowest in over a year. This reflects silver vastly outperforming gold in percentage terms, though the ratio remains above long-term averages of about 67, which is expected to be hit by June 2026.

CME QuikStrike shows that the options contract expiring late February has the second largest OI as of today, following the Dec/25 contract.

Source: CME QuikStrike
For SOH6, the strike-wise open interest shows a concentration of much higher call OI at OTM strike levels than for OTM puts.
Overall put-call ratio for this contract is outrightly bullish at 0.54, which is lower than the average of all expiries (0.68).

Source: CME QuikStrike
The last time the gold-silver ratio was this low, after having retreated from a peak, was in December 2020.

During that period of GSR dipping from current levels to the long-term average, silver futures rallied by 21.8%.

The P&L for entering a long futures trade during that period would be as follows:
Contract size: 5,000 troy ounces
Entry: 25.00
Exit: 29.40
Price move: 29.40 − 25.00 = $4.40/oz
Dollar P&L per contract: 4.40 × 5,000 oz = 22,000 USD per contract
Given the lower bound of our ETA on mean reversion is 49 days, selecting a contract that expires in Feb/2026 is useful.
Investors can also utilise CME Micro Silver futures, which offer smaller notional positions and greater flexibility. Each Micro contract is priced in USD per ounce and represents 1,000 ounces of silver, compared to 5,000 ounces for the standard contract.
This content is sponsored.
MARKET DATA
CME Real-time Market Data helps identify trading set-ups and express market views better. If you have futures in your trading portfolio, you can check out on CME Group data plans available that suit your trading needs tradingview.com/cme.
DISCLAIMER
This case study is for educational purposes only and does not constitute investment recommendations or advice. Nor are they used to promote any specific products, or services.
Trading or investment ideas cited here are for illustration only, as an integral part of a case study to demonstrate the fundamental concepts in risk management or trading under the market scenarios being discussed. Please read the FULL DISCLAIMER the link to which is provided in our profile description.
This extraordinary rally underscores silver’s dual nature as both an industrial commodity and a safe-haven asset, driven by a perfect storm of robust demand, persistent supply deficits, and supportive macroeconomic conditions.
Macroeconomic Shifts and a Softer U.S. Dollar
Monetary policy tailwinds have bolstered silver’s ascent.
After keeping interest rates at a restrictive high throughout most of 2025, the Federal Reserve began easing with a 25 bps rate cut in October, and markets widely anticipate another cut at the upcoming December 9–10 meeting.
CME FedWatch shows 86% odds of a December rate reduction as against last month’s 69% probability, following recent weak jobs data, with jobless claims diving to a multi-year low. Analysts believe private investors increased allocations after those cuts, considering silver a higher-beta alternative to gold.
Source: CME FedWatch
ADP’s private data showed a drop of 32,000 roles in November, with wage growth also on a downward trend.
The prospect of Fed easing has weakened the U.S. dollar and lowered bond yields, enhancing the appeal of non-yielding assets like silver.
Earlier this year, traders rushed massive volumes of silver into U.S. vaults earlier in order to avoid tariffs, and while this temporarily ballooned U.S. inventories, it drained liquidity from overseas markets and stoked fears of shortages.
This time around, tariffs risk has increased owing to silver being included in the critical minerals list, making fear an additional driver along with macro dynamics, even as industrial demand is not growing as fast.
Physical Market Tightness and Industrial Demand
Silver’s recent price surge is being driven by an exceptionally tight physical market. Global demand is again set to outpace supply in 2025, marking the fifth consecutive year of deficit. Even with mine output holding steady, the Silver Institute projects a 95-million-ounce shortfall, bringing the cumulative deficit since 2021 to nearly 820 million ounces.
By October, London, the world’s main physical trading hub, saw heavy drawdowns in vault stockpiles as metal was shipped out to meet surging U.S. and Indian demand, leading to a collapse in free-float inventory. Silver lease rates in London spiked above 11%, an extraordinarily high level, reflecting the urgency to obtain physical metal.
Meanwhile, a geographic dislocation emerged. So much silver was shipped into U.S. COMEX warehouses this year (ahead of tariffs) that record inventories accumulated – over 530 million ounces by October.
Source: DataTrack
Since then, with tariff risks alleviated, the metal began shifting to London again, seeing as the spot there was now higher than in the United States as of 04/Dec, COMEX inventories are back to mid-March levels.
Crucially, industrial demand remains a strong pillar beneath the silver market, even if it isn’t growing all that fast. Even though high prices have prompted some thrifting, where less silver is used per device, total industrial usage is still projected to reach roughly 665 million ounces in 2025, 2% below last year’s record.
Green technologies continue to be a major silver driver. For perspective, solar energy alone likely accounted for on the order of 200 Moz of silver demand in 2024, and global EV manufacturing is estimated to add another 90 Moz in 2025. With new mining projects projected to add only about 44 Moz of additional annual supply over the next 5-10 years, these industrial needs ensure that any demand surge hits a supply wall.
While current industrial growth numbers may not look promising, it is more about the inelasticity of demand, which is still being met with persistent deficits. With investor buying on the rise, the chances of supply hiccups only increase.
Investor Flows and Market Positioning Favour Further Gains
By early November, global silver ETP holdings had swollen by roughly 18% YTD, putting total holdings near all-time highs. Importantly, about half of these ETP holdings are stored in London, meaning a large portion of the world’s investment silver became effectively tied up in vaults.
Physical investment demand is robust as well. India, the world’s largest silver importer, saw buoyant buying even at record rupee prices, with continued accumulation of silver on price dips.
The iShares SLV ETF netted inflows of USD 1,227.6 million over the past 3 months.
After starting the year above 100:1, the gold: silver ratio fell to sub-72 by December, the lowest in over a year. This reflects silver vastly outperforming gold in percentage terms, though the ratio remains above long-term averages of about 67, which is expected to be hit by June 2026.
CME QuikStrike shows that the options contract expiring late February has the second largest OI as of today, following the Dec/25 contract.
Source: CME QuikStrike
For SOH6, the strike-wise open interest shows a concentration of much higher call OI at OTM strike levels than for OTM puts.
Overall put-call ratio for this contract is outrightly bullish at 0.54, which is lower than the average of all expiries (0.68).
Source: CME QuikStrike
The last time the gold-silver ratio was this low, after having retreated from a peak, was in December 2020.
During that period of GSR dipping from current levels to the long-term average, silver futures rallied by 21.8%.
The P&L for entering a long futures trade during that period would be as follows:
Contract size: 5,000 troy ounces
Entry: 25.00
Exit: 29.40
Price move: 29.40 − 25.00 = $4.40/oz
Dollar P&L per contract: 4.40 × 5,000 oz = 22,000 USD per contract
Given the lower bound of our ETA on mean reversion is 49 days, selecting a contract that expires in Feb/2026 is useful.
Investors can also utilise CME Micro Silver futures, which offer smaller notional positions and greater flexibility. Each Micro contract is priced in USD per ounce and represents 1,000 ounces of silver, compared to 5,000 ounces for the standard contract.
This content is sponsored.
MARKET DATA
CME Real-time Market Data helps identify trading set-ups and express market views better. If you have futures in your trading portfolio, you can check out on CME Group data plans available that suit your trading needs tradingview.com/cme.
DISCLAIMER
This case study is for educational purposes only and does not constitute investment recommendations or advice. Nor are they used to promote any specific products, or services.
Trading or investment ideas cited here are for illustration only, as an integral part of a case study to demonstrate the fundamental concepts in risk management or trading under the market scenarios being discussed. Please read the FULL DISCLAIMER the link to which is provided in our profile description.
Full Disclaimer - linktr.ee/mintfinance
Disclaimer
The information and publications are not meant to be, and do not constitute, financial, investment, trading, or other types of advice or recommendations supplied or endorsed by TradingView. Read more in the Terms of Use.
Full Disclaimer - linktr.ee/mintfinance
Disclaimer
The information and publications are not meant to be, and do not constitute, financial, investment, trading, or other types of advice or recommendations supplied or endorsed by TradingView. Read more in the Terms of Use.