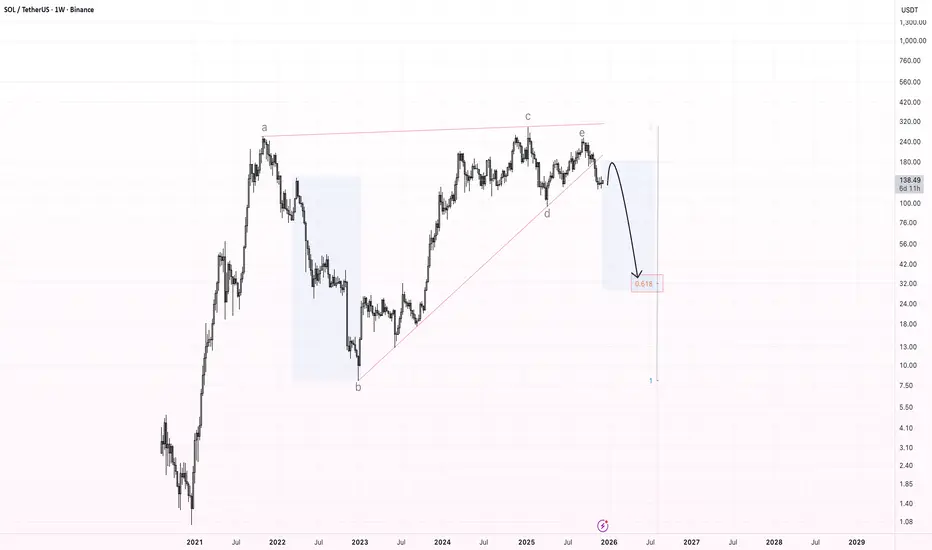
The chart shows a large multi-year bearish rising wedge, which has now been broken to the downside. This wedge has been forming since the 2022 bottom and consists of clear wave structure (a–b–c–d–e), with the final wave e rejecting at the upper boundary and triggering the breakdown.
After this kind of pattern, the market often provides a relief bounce back into the broken support, which should now act as resistance. For SOL, the expected retest zone is located around $170–$190.
If price confirms resistance there, I expect the beginning of a larger downward wave, targeting the main Fibonacci zone near the 0.618 retracement, which aligns with a long-term target around $30–$40.
This zone marks the primary downside target for a full wedge breakdown.
Key Points:
- Multi-year bearish rising wedge has broken.
- Expected retest: $170–$190.
- Major downside target: $30–$40 (0.618 zone).
- Potential start of a macro corrective wave.
Disclaimer
The information and publications are not meant to be, and do not constitute, financial, investment, trading, or other types of advice or recommendations supplied or endorsed by TradingView. Read more in the Terms of Use.
Disclaimer
The information and publications are not meant to be, and do not constitute, financial, investment, trading, or other types of advice or recommendations supplied or endorsed by TradingView. Read more in the Terms of Use.