SONACOMS – Falling Wedge Pattern Formation
Timeframe: Daily Chart
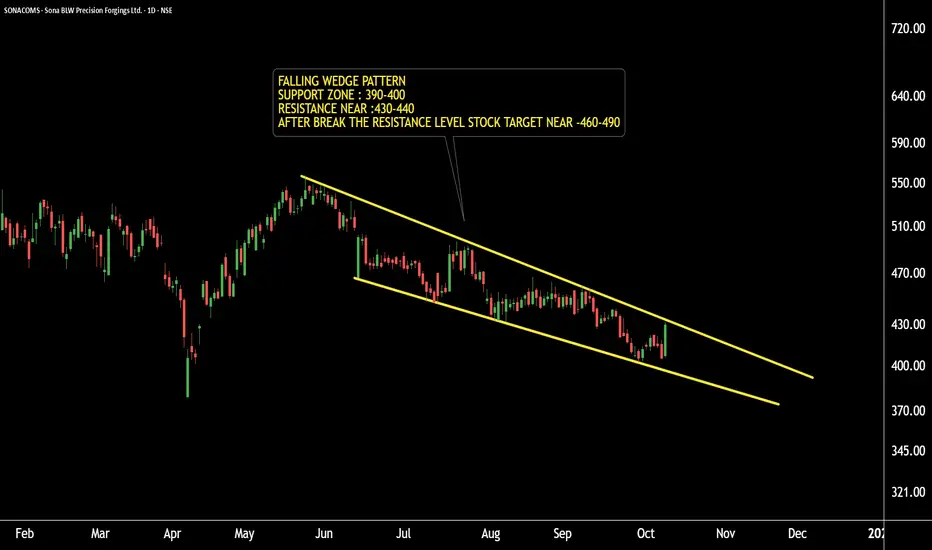
SONACOMS is forming a Falling Wedge pattern, which is a bullish reversal pattern in a bearish market phase.
The support zone is placed around ₹390–₹400 levels.
The resistance level is around ₹430.
A breakout above ₹430 may lead to pattern targets near ₹460 and ₹490.
If the support zone holds, we may witness higher prices in SONACOMS in the coming sessions.
Conclusion: Watch for a breakout confirmation for potential upside momentum.
Thank you !!
Timeframe: Daily Chart
SONACOMS is forming a Falling Wedge pattern, which is a bullish reversal pattern in a bearish market phase.
The support zone is placed around ₹390–₹400 levels.
The resistance level is around ₹430.
A breakout above ₹430 may lead to pattern targets near ₹460 and ₹490.
If the support zone holds, we may witness higher prices in SONACOMS in the coming sessions.
Conclusion: Watch for a breakout confirmation for potential upside momentum.
Thank you !!
@RahulSaraoge
Connect us at t.me/stridesadvisory
Connect us at t.me/stridesadvisory
Disclaimer
The information and publications are not meant to be, and do not constitute, financial, investment, trading, or other types of advice or recommendations supplied or endorsed by TradingView. Read more in the Terms of Use.