Chart Patterns ranked by reliability (1-8)Chart Patterns as a Strategy (Not a System)
In the world of technical analysis, chart patterns are often marketed as stand-alone trading systems. In reality, their real edge comes from probabilistic structure recognition, not prediction.
The key insight from my large-sample testing (10 years, 200,
About S&P 500 Index
Standard & Poor’s 500 is an American stock market index consisting of 500 large companies having common stock listed on the NYSE or NASDAQ and their market capitalizations. It captures approximately 80% coverage of available market capitalization. Because it includes both growth stocks and value stocks it is one of the most followed equity indices and is considered to be one of the best representations of the U.S. stock market and a trend indicator for the U.S. economy. S&P introduced its first index in 1923 and its present day form on March 4,1957. It was developed and continues to maintained by S&P Dow Jones Indices, a joint venture majority owned by McGraw Hill Financial.

Stocks Shake as Prosecutors Go After Fed Boss Powell. Now What?Wall Street went into the weekend riding record highs — and came back to something that felt more like a political thriller than a macro update.
US stock futures slipped after news broke that the Department of Justice has opened a criminal investigation into Federal Reserve Chair Jerome Powell, sha

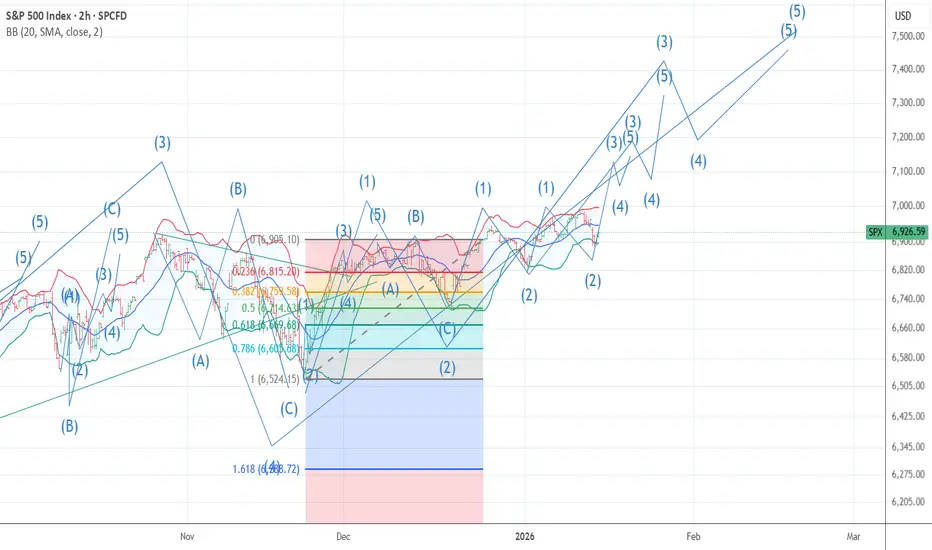
Hellena | SPX500 (4H): LONG to resistance area of 7050.Colleagues, the upward movement is not yet complete and remains a priority, but there is one caveat. The completion of the medium-term wave “1” (blue) is quite difficult to predict, as the junior wave ‘3’ may turn out to be wave “5”, since the structure resembles an initial diagonal. However, this d

I am now 90 % short 6984 Wave 5 looks doneThe chart posted is the cash sp 500 I had hoped to see 7031 but as i have stated for a few weeks the high should be from 6954 to 7031 there is a great deal of math at 6984 I have labeled the rally as DONE best of trades WAVETIMER

THE BULLISH ALT WAVE COUNT FORM ONLY This is the Bullish alt wave count I am ONLY posting it And have major doubt But would be happening if we were to get above 7188 The reason I have little faith in this is a model I have back tested by to 1902 using the DJI it has 13 signals and it was 100 % I post the signal on X
S&P500 This tight squeeze can trigger a massive 2026 correction.The S&P500 (SPX) made a new All Time High (ATH) touching yet again the Higher Highs trend-line of last October (2025). This is the same chart we first published last week only this time on the 1D time-frame. The reason is that, with the 1D MA100 (green trend-line) rising fast, it creates a tight squ

S&P 500 to 7300 over the next 60 days** Short term outlook **
On the above daily chart:
1. Price action prints multiple higher lows.
2. An RSI resistance breakout has printed.
3. The last higher low print is followed with a confirmation of support on past resistance.
4. An inverse head and shoulder print confirms, with forecast to 73

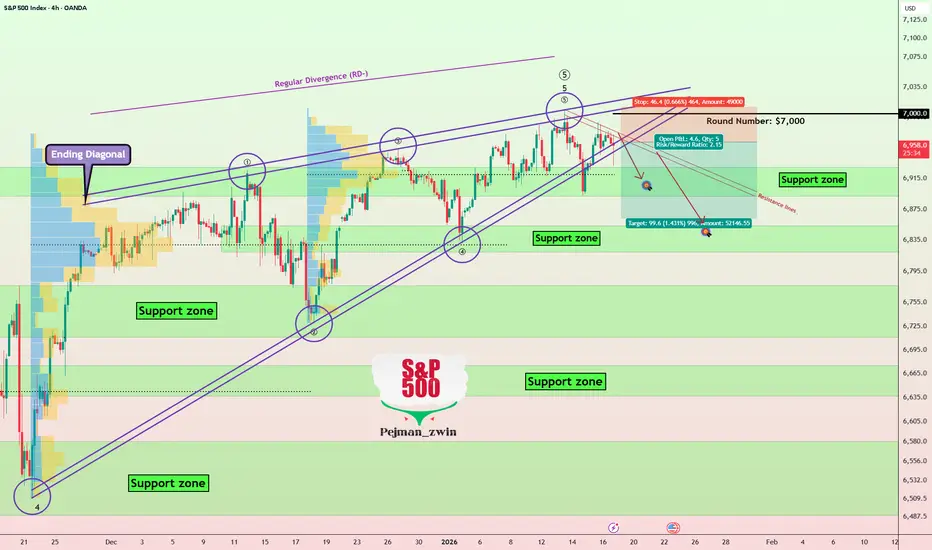
S&P 500 Completes Wave 5 via Ending Diagonal — Correction Ahead?The S&P 500( FX:SPX500 ) is a crucial index in the financial markets, and understanding its trends can greatly help in analyzing other markets, such as cryptocurrencies, especially Bitcoin( BINANCE:BTCUSDT ).
The S&P 500 is currently near its resistance lines, and from a classic technical analysis
Still waiting for a correction in the S&P 500Still waiting for a correction in the S&P 500 from its peak, around 10% or so.
The correction pattern looks pretty similar to what we saw at the start of 2025, let's see how it plays out this time.
Target: $6250

SPX – GEX Back to Positive🔶 SPX – HVL Reclaim & GEX Shift 🔶
SPX briefly traded below the High Volatility Level (HVL) yesterday, entering a 🔴 negative GEX regime , which increased downside sensitivity and intraday volatility. However, that breakdown failed to follow through.
Price has since reclaimed the HVL , and bas

See all ideas
Displays a symbol's value movements over previous years to identify recurring trends.
Frequently Asked Questions
S&P 500 Index reached its highest quote on Jan 9, 2026 — 6,978.6 USD. See more data on the S&P 500 Index chart.
The lowest ever quote of S&P 500 Index is 665.6 USD. It was reached on Mar 6, 2009. See more data on the S&P 500 Index chart.
S&P 500 Index is just a number that lets you track performance of the instruments comprising the index, so you can't invest in it directly. But you can buy S&P 500 Index futures or funds or invest in its components.