🔎 Recent snapshot
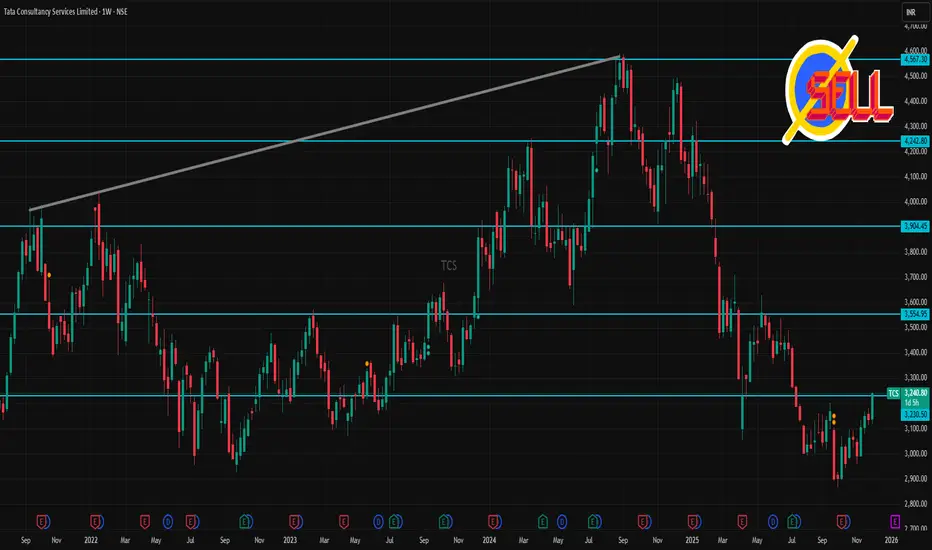
According to a recent technical‑analysis update, TCS has support near ₹2,970–₹2,870 and resistance near ₹3,170, ₹3,207, ₹3,270 on the shorter‑term charts.
On a weekly / medium‑term view, some oversold‑indicator signals have been flagged, suggesting the stock could attempt a rebound if support holds.
Analysts’ longer‑term target (12‑month) sits around ₹3,505–₹3,470, implying moderate upside from current levels.
⚠️ What could derail upside
If the stock falls below the lower support of ~₹2,870‑₹2,950, it may test deeper support zones.
Mixed signals from oscillators (some suggest bearish momentum) could limit strong short‑term rallies.
🎯 My take (for 1‑week traders)
TCS seems to be in a consolidation/neutral posture — the next few days could be defined by support‑vs‑resistance play. If you trade short‑term, the ~₹3,030–₹3,170 band defines a likely “play zone.” A decisive move beyond that could hint at short‑term trend direction.
Related publications
Disclaimer
The information and publications are not meant to be, and do not constitute, financial, investment, trading, or other types of advice or recommendations supplied or endorsed by TradingView. Read more in the Terms of Use.
Related publications
Disclaimer
The information and publications are not meant to be, and do not constitute, financial, investment, trading, or other types of advice or recommendations supplied or endorsed by TradingView. Read more in the Terms of Use.