The text is a bit long, but it contains valuable insights. I’ve reviewed the past and discussed the #TOTAL3 chart update at the end, so make sure to read the full text and check the charts and previous posts linked for reference.
1. In my initial analysis on July 9, I mentioned that in the long-term view, the TOTAL3 index was heading toward the red box. This played out, with the index rising about 38%, leading to 40-70% gains in altcoins.

2. On July 19 , I explained this chart further, noting that many believed the altcoin season had started and altcoins would see significant gains. However, the chart showed we were in wave-(D) of a neutral triangle, indicating that the major altcoin surge people expected wasn’t here yet.
3. In my latest analysis on September 26, I wrote:
"The Running Triangle pattern remains valid. However, with wave-e breaking the a-c trendline, we should consider this a warning. There’s a possibility that a Diametric pattern could form instead of a Running Triangle.
Altcoin Market:
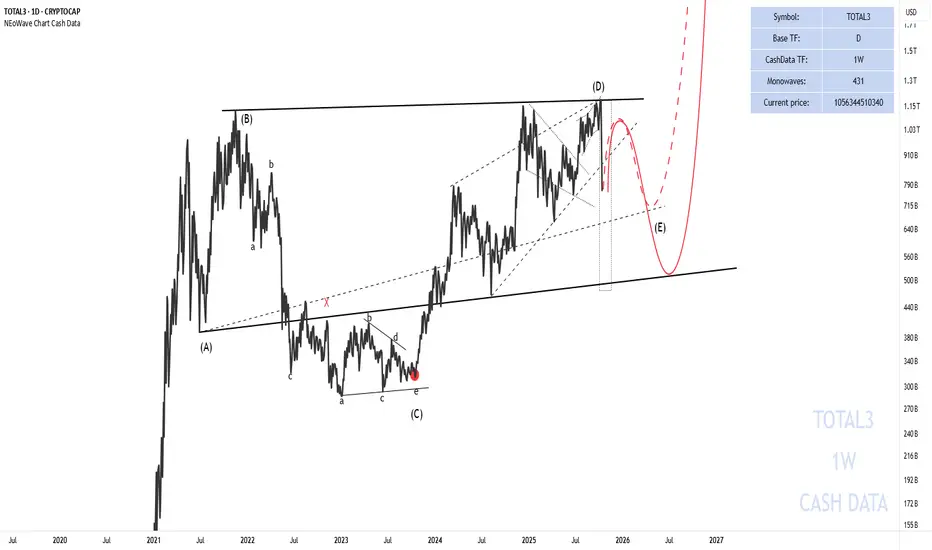
As I previously stated, the altseason many analysts expect hasn’t arrived yet. Looking at the 1W cash data chart, we’re in wave-(D) of a Neutral Triangle. Still, I believe altcoins could see 30-70% growth. In my view, the main altseason is likely to occur in 2026. To pinpoint the start, we need to wait for wave-(D) to complete."

4. #TOTAL3 Chart Update:
As noted in my last analysis, the final part of wave-(D) turned into a Diametric pattern (explained in the latest #TOTAL3 analysis). Exactly from the red box, a sharp 35% drop in the #TOTAL3 index occurred. This suggests that wave-(D) of the neutral triangle has ended, and wave-(E) has begun. Based on the price size of wave-(D), the final wave of the neutral triangle could complete at 699B or 514B, after which the main altcoin rally should start. I expected another upward move, but Trump’s influence halted the growth.
Good luck
NEoWave Chart
1. In my initial analysis on July 9, I mentioned that in the long-term view, the TOTAL3 index was heading toward the red box. This played out, with the index rising about 38%, leading to 40-70% gains in altcoins.
2. On July 19 , I explained this chart further, noting that many believed the altcoin season had started and altcoins would see significant gains. However, the chart showed we were in wave-(D) of a neutral triangle, indicating that the major altcoin surge people expected wasn’t here yet.
3. In my latest analysis on September 26, I wrote:
"The Running Triangle pattern remains valid. However, with wave-e breaking the a-c trendline, we should consider this a warning. There’s a possibility that a Diametric pattern could form instead of a Running Triangle.
Altcoin Market:
As I previously stated, the altseason many analysts expect hasn’t arrived yet. Looking at the 1W cash data chart, we’re in wave-(D) of a Neutral Triangle. Still, I believe altcoins could see 30-70% growth. In my view, the main altseason is likely to occur in 2026. To pinpoint the start, we need to wait for wave-(D) to complete."
4. #TOTAL3 Chart Update:
As noted in my last analysis, the final part of wave-(D) turned into a Diametric pattern (explained in the latest #TOTAL3 analysis). Exactly from the red box, a sharp 35% drop in the #TOTAL3 index occurred. This suggests that wave-(D) of the neutral triangle has ended, and wave-(E) has begun. Based on the price size of wave-(D), the final wave of the neutral triangle could complete at 699B or 514B, after which the main altcoin rally should start. I expected another upward move, but Trump’s influence halted the growth.
Good luck
NEoWave Chart
Disclaimer
The information and publications are not meant to be, and do not constitute, financial, investment, trading, or other types of advice or recommendations supplied or endorsed by TradingView. Read more in the Terms of Use.
Disclaimer
The information and publications are not meant to be, and do not constitute, financial, investment, trading, or other types of advice or recommendations supplied or endorsed by TradingView. Read more in the Terms of Use.