The Anatomy of a Trap: Total 3Chart, Wyckoff Distribution
Price action is beginning to show characteristics often associated with distribution. Multiple retests of resistance with waning momentum could be a sign of absorption rather than genuine strength. If this pattern develops further, the next move may involve a deceptive breakout attempt before revealing the market’s true direction.”
Note
Note
Update Note
🐂 🪤Note
Note
The real move has been reveled.. see you guys below 700BNote
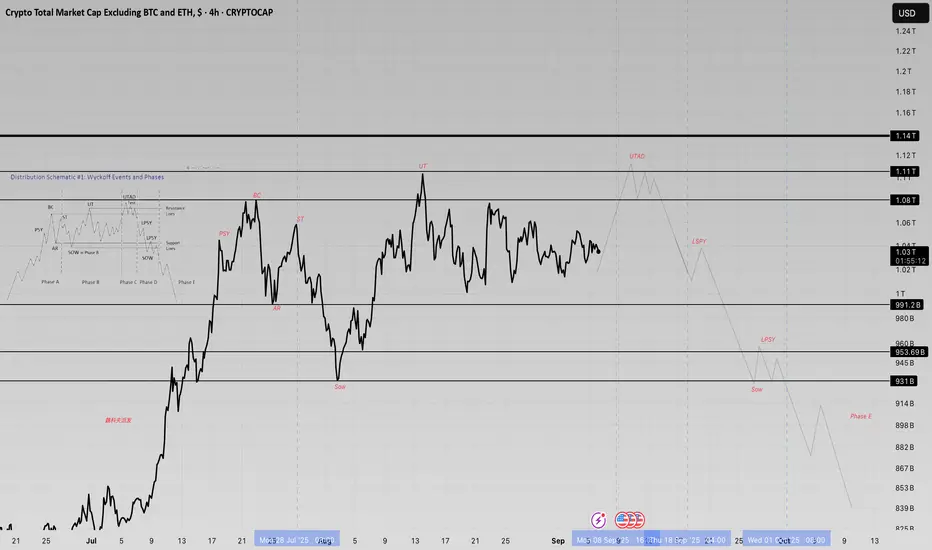
This level represents the critical Point of No Return within the distribution schematic.Sustained acceptance and consolidation above the invalidation zone would negate the UTAD and signal a shift toward re-accumulation, while a decisive rejection would reaffirm supply dominance and preserve the bearish distribution outlook. Based on the striking similarity between the current structure and the schematic circled within the blue chart, I lean toward the latter scenario unfolding. #TOTAL3
Note
It’s not perfect, but my analysis was accurate. As I’ve maintained, this move was a trap. We are currently in Phase C, with the first peak forming as we approach the UTAD. In the reference schematic (shown below the price action), you’ll notice that each subsequent peak within Phase C trends lower. In the current price action, the initial peak appears to be part of a broader formation that suggests the market will continue making lower lows.Related publications
Disclaimer
The information and publications are not meant to be, and do not constitute, financial, investment, trading, or other types of advice or recommendations supplied or endorsed by TradingView. Read more in the Terms of Use.
Related publications
Disclaimer
The information and publications are not meant to be, and do not constitute, financial, investment, trading, or other types of advice or recommendations supplied or endorsed by TradingView. Read more in the Terms of Use.