1. Chart Overview
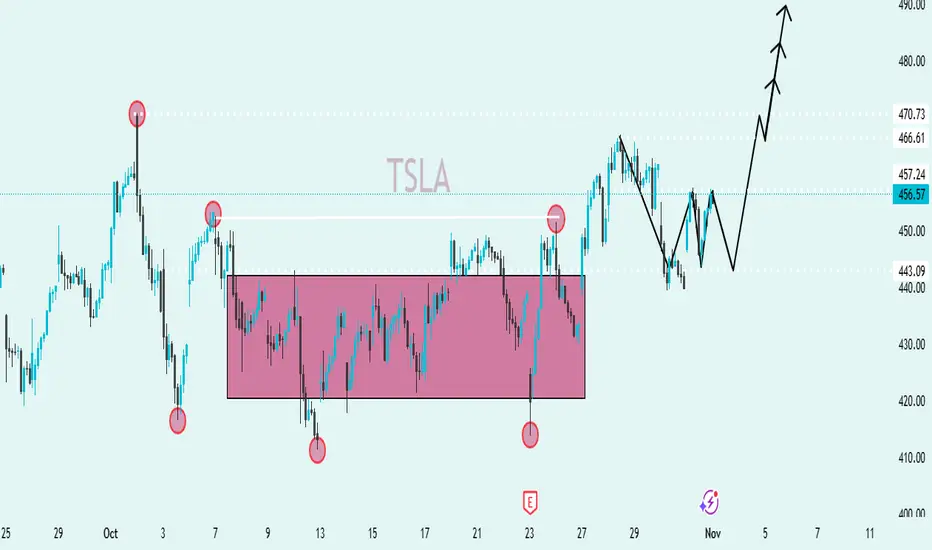
Ticker: TSLA (Tesla)
Timeframe: Short-term (likely 1-hour or 4-hour chart)
Current Price: Around $456.57
Date: November 1, 2025 (as shown on the chart)
---
🧩 2. Key Technical Structures
🔸 Range (Consolidation Zone)
The pink shaded box marks a sideways consolidation/range between roughly $430 and $450.
Price moved horizontally within this box for several sessions, indicating indecision or accumulation.
🔸 Breakout
Price has broken above the upper boundary of this range near $450, signaling a bullish breakout.
The breakout confirms that buyers gained control after a period of consolidation.
🔸 Support and Resistance Levels
Support: ~$443.09 — previous lower boundary of the range.
Resistance Levels:
$457.24 (current level, acting as pivot)
$466.61 (next resistance)
$470.73 (major target level)
---
📈 3. Pattern Recognition
The marked highs and lows (red circles) suggest a double bottom formation inside the range, which is a bullish reversal pattern.
The projection (black arrow) shows a retracement (minor dip) before a strong upward continuation toward $470+.
This path suggests a bullish wave structure (Elliott Wave–style impulse count or continuation move).
---
⚙️ 4. Technical Outlook
🔹 Bullish Scenario
If price holds above $450, TSLA is expected to move higher toward $466 → $471 → $480+.
The pattern implies momentum continuation after consolidation.
🔹 Bearish Risk
A drop below $443 would invalidate the bullish scenario and could lead back into the previous range (~$430).
---
📊 5. Summary
Aspect Observation
Trend Transitioning from range to bullish
Pattern Range breakout + potential bullish continuation
Key Support $443
Immediate Resistance $457
Targets $466, $471, $480
Bias Bullish (as long as $443 holds)
---
✅ Conclusion:
This chart suggests that TSLA has broken out of a consolidation phase and is now poised for a bullish continuation. Traders may look for buying opportunities above $450 with potential upside targets near $470–$480, while maintaining caution if price falls back below $443.
Trade active
JOIN MY TELEGRAM CHANNEL LINK 👇🏻
t.me/Classicallegendschool
t.me/Classicallegendschool
Disclaimer
The information and publications are not meant to be, and do not constitute, financial, investment, trading, or other types of advice or recommendations supplied or endorsed by TradingView. Read more in the Terms of Use.