TSM: Unveiling Over 40% Undervaluation – SWOT and Intrinsic Value Deep Dive
Introduction
📊 As of October 27, 2025, Taiwan Semiconductor Manufacturing Company Limited (TSM), the world's leading semiconductor foundry specializing in advanced chip production for AI and high-performance computing, is riding a wave of AI-driven growth amid broader technology sector momentum. Macroeconomic factors, including surging demand for AI infrastructure and stabilizing global supply chains, have fueled positive shifts in investor sentiment.
Sector dynamics feature rapid adoption of 3nm and 2nm technologies, with public data from recent earnings highlighting quarterly revenue growth of 40.1% year-over-year, positioning TSM for continued expansion in a high-growth environment. This overview is based on verifiable metrics without promoting any investment.
SWOT Analysis
Strengths 💹
TSM holds a dominant market position with first-mover advantages in advanced nodes, supplying chips to leading companies like NVIDIA and Apple, which drives consistent demand. Financial robustness is evident in its low debt-to-equity ratio of 19.00%, strong operating cash flows, and quarterly earnings growth of 52.98% year-over-year, supported by economies of scale and technological leadership. Global fabrication facilities enhance resilience and efficiency.
Weaknesses ⚠️
Geopolitical vulnerabilities tied to Taiwan's location expose TSM to potential disruptions from cross-strait tensions or trade restrictions. High capital expenditures for R&D and fab expansions strain short-term margins, while talent shortages in specialized engineering could hinder innovation pace. Return on assets remains moderate amid intensive investments.
Opportunities 🚀
TSM's undervalued metrics, such as a forward P/E of 24.73 and PEG ratio around 0.83, make it attractive for growth investors amid AI megatrends. Analyst projections forecast 30% revenue growth for 2025, reaching approximately $120B, with EPS expansion of 19.8% to $12.34 in 2026, driven by AI/HPC segments and expansions in Arizona and Japan. Emerging opportunities in IoT, automotive chips, and quantum computing further bolster long-term prospects.
Threats 🛑
Intensifying competition from Intel's foundry ambitions and Samsung could pressure market share, while U.S.-China trade tensions risk supply chain interruptions. Cyclical semiconductor demand and potential economic slowdowns may impact client orders, with regulatory scrutiny on technology exports adding uncertainty.
Intrinsic Value Calculation
💰 Value investing focuses on estimating intrinsic value to spot assets below their fundamental worth, applying a margin of safety for risks like geopolitical factors. For growth-oriented firms like TSM, we weight book value lower (e.g., 0.3) to emphasize earnings potential: Intrinsic Value = (Book Value per Share × Weight) + (Forward EPS × Growth Multiplier), with a multiplier (e.g., 40) reflecting sector growth averages adjusted for 30% projected expansion.
Using recent data: Book Value per Share ≈ $31.85 (adjusted for ADR), Forward EPS = $12.34. Assume a 25% average growth rate from revenue and EPS forecasts, supporting the multiplier for sustainability.
Calculation:
- Book component: $31.85 × 0.3 = $9.555
- Earnings component: $12.34 × 40 = $493.6
- Intrinsic Value ≈ $9.555 + $493.6 = $503.155
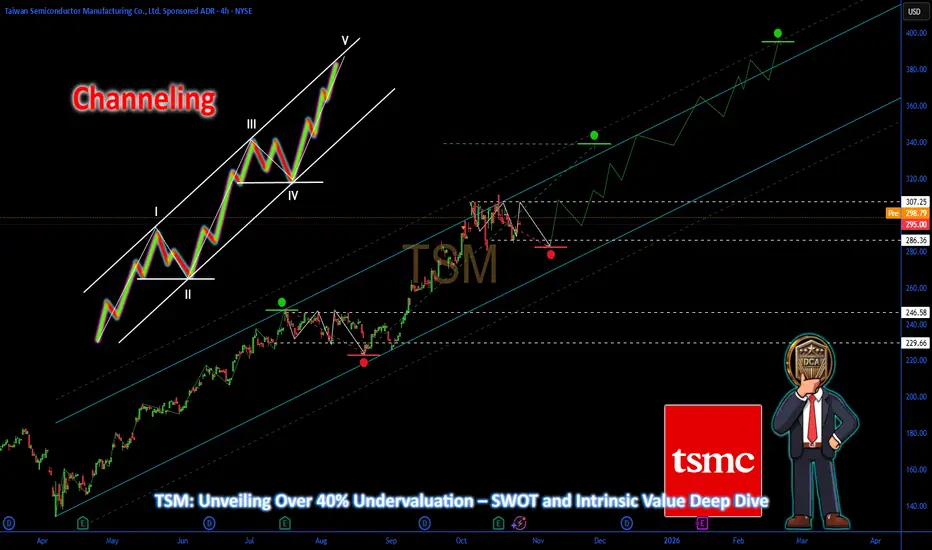
Compared to the current price of $294.96, TSM appears undervalued by over 40%, offering a strong margin of safety (e.g., 30-50% discount to account for threats like competition). 📉 Debt flags are minimal at 19% D/E, with robust earnings momentum (24.6% growth to $15.48 in 2027) underpinning long-term sustainability if global demand persists. Annotate intrinsic value lines in green on the chart, with current price in red for visual comparison.
Entry Strategy Insights
🔍 Institutional strategies target bottom-extreme zones, such as oversold levels from historical supports during sector pullbacks, for unleveraged long-term positions. Dollar-cost averaging enables gradual accumulation in dips, leveraging non-repainting price signals for reversal confirmation. For TSM, scan areas near key moving averages amid AI-driven rebounds, focusing on fundamentals like revenue surges over volatility.
Risk Management
⚠️ Constrain position sizing to 1-5% of capital to manage potential downturns. Diversify across semiconductors and tech to buffer geopolitical exposures, committing to long-term holds based on sustained AI growth. Review debt and capex in quarterly reports, with predefined exits for escalating trade risks or demand softening.
Conclusion
This breakdown illuminates TSM's technological strengths and AI opportunities, mitigated by external threats, with intrinsic assessments revealing significant upside for growth-focused investors. Independently verify through latest filings and seek professional counsel.
This is educational content only; not financial advice. Always conduct your own due diligence.
Introduction
📊 As of October 27, 2025, Taiwan Semiconductor Manufacturing Company Limited (TSM), the world's leading semiconductor foundry specializing in advanced chip production for AI and high-performance computing, is riding a wave of AI-driven growth amid broader technology sector momentum. Macroeconomic factors, including surging demand for AI infrastructure and stabilizing global supply chains, have fueled positive shifts in investor sentiment.
Sector dynamics feature rapid adoption of 3nm and 2nm technologies, with public data from recent earnings highlighting quarterly revenue growth of 40.1% year-over-year, positioning TSM for continued expansion in a high-growth environment. This overview is based on verifiable metrics without promoting any investment.
SWOT Analysis
Strengths 💹
TSM holds a dominant market position with first-mover advantages in advanced nodes, supplying chips to leading companies like NVIDIA and Apple, which drives consistent demand. Financial robustness is evident in its low debt-to-equity ratio of 19.00%, strong operating cash flows, and quarterly earnings growth of 52.98% year-over-year, supported by economies of scale and technological leadership. Global fabrication facilities enhance resilience and efficiency.
Weaknesses ⚠️
Geopolitical vulnerabilities tied to Taiwan's location expose TSM to potential disruptions from cross-strait tensions or trade restrictions. High capital expenditures for R&D and fab expansions strain short-term margins, while talent shortages in specialized engineering could hinder innovation pace. Return on assets remains moderate amid intensive investments.
Opportunities 🚀
TSM's undervalued metrics, such as a forward P/E of 24.73 and PEG ratio around 0.83, make it attractive for growth investors amid AI megatrends. Analyst projections forecast 30% revenue growth for 2025, reaching approximately $120B, with EPS expansion of 19.8% to $12.34 in 2026, driven by AI/HPC segments and expansions in Arizona and Japan. Emerging opportunities in IoT, automotive chips, and quantum computing further bolster long-term prospects.
Threats 🛑
Intensifying competition from Intel's foundry ambitions and Samsung could pressure market share, while U.S.-China trade tensions risk supply chain interruptions. Cyclical semiconductor demand and potential economic slowdowns may impact client orders, with regulatory scrutiny on technology exports adding uncertainty.
Intrinsic Value Calculation
💰 Value investing focuses on estimating intrinsic value to spot assets below their fundamental worth, applying a margin of safety for risks like geopolitical factors. For growth-oriented firms like TSM, we weight book value lower (e.g., 0.3) to emphasize earnings potential: Intrinsic Value = (Book Value per Share × Weight) + (Forward EPS × Growth Multiplier), with a multiplier (e.g., 40) reflecting sector growth averages adjusted for 30% projected expansion.
Using recent data: Book Value per Share ≈ $31.85 (adjusted for ADR), Forward EPS = $12.34. Assume a 25% average growth rate from revenue and EPS forecasts, supporting the multiplier for sustainability.
Calculation:
- Book component: $31.85 × 0.3 = $9.555
- Earnings component: $12.34 × 40 = $493.6
- Intrinsic Value ≈ $9.555 + $493.6 = $503.155
Compared to the current price of $294.96, TSM appears undervalued by over 40%, offering a strong margin of safety (e.g., 30-50% discount to account for threats like competition). 📉 Debt flags are minimal at 19% D/E, with robust earnings momentum (24.6% growth to $15.48 in 2027) underpinning long-term sustainability if global demand persists. Annotate intrinsic value lines in green on the chart, with current price in red for visual comparison.
Entry Strategy Insights
🔍 Institutional strategies target bottom-extreme zones, such as oversold levels from historical supports during sector pullbacks, for unleveraged long-term positions. Dollar-cost averaging enables gradual accumulation in dips, leveraging non-repainting price signals for reversal confirmation. For TSM, scan areas near key moving averages amid AI-driven rebounds, focusing on fundamentals like revenue surges over volatility.
Risk Management
⚠️ Constrain position sizing to 1-5% of capital to manage potential downturns. Diversify across semiconductors and tech to buffer geopolitical exposures, committing to long-term holds based on sustained AI growth. Review debt and capex in quarterly reports, with predefined exits for escalating trade risks or demand softening.
Conclusion
This breakdown illuminates TSM's technological strengths and AI opportunities, mitigated by external threats, with intrinsic assessments revealing significant upside for growth-focused investors. Independently verify through latest filings and seek professional counsel.
This is educational content only; not financial advice. Always conduct your own due diligence.
⚡️ Request a trial or subscribe to our premium🛠️tools at ➡️DCAlpha.net
All scripts & content provided by DCAChampion are for informational & educational purposes only.
All scripts & content provided by DCAChampion are for informational & educational purposes only.
Disclaimer
The information and publications are not meant to be, and do not constitute, financial, investment, trading, or other types of advice or recommendations supplied or endorsed by TradingView. Read more in the Terms of Use.