📉 Chart Overview:
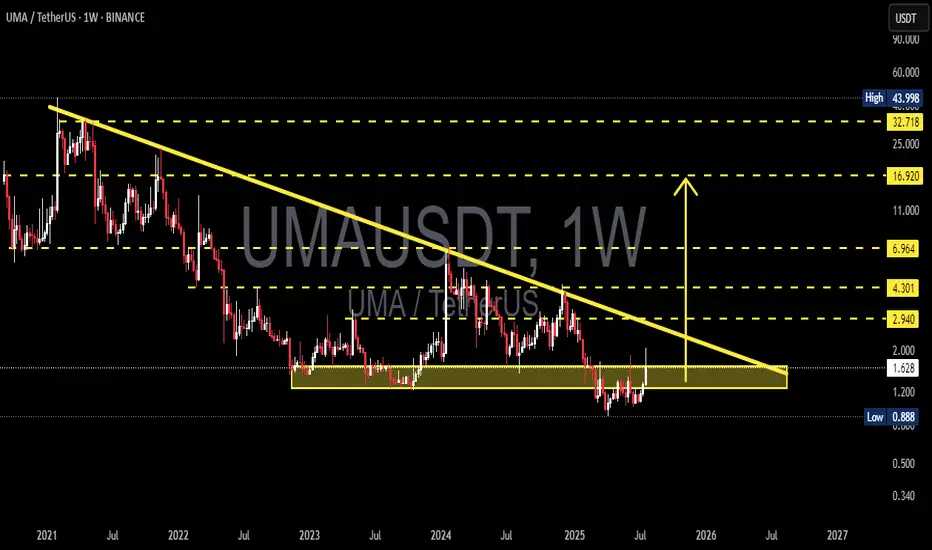
UMA/USDT has been in a long-term downtrend since its peak in 2021. For nearly three years, price action has been trapped within a descending triangle pattern, forming consistent lower highs while holding a strong horizontal support zone around $0.88 – $1.20.
Over the last two years, UMA has been consolidating sideways, creating a massive accumulation base. Now, the price is sitting just beneath the descending trendline, putting the asset in a critical compression zone — a potential breakout could trigger a major trend shift.
🔍 Technical Pattern Breakdown:
Multi-year Descending Triangle structure with a well-defined horizontal base.
Long-term accumulation zone between $0.88 – $1.20, repeatedly tested but not broken.
UMA is currently pressing against the descending resistance line, building pressure.
Setup hints at a compression breakout, often leading to explosive moves when volume confirms.
🟢 Bullish Scenario – If Breakout Confirms:
If UMA breaks out convincingly above the descending trendline (~$1.85) with a weekly candle close and strong volume, the market could start targeting these levels:
1. ✅ $2.94 – First horizontal resistance from prior breakdown zone.
2. ✅ $4.30 – Key structure from mid-2023.
3. ✅ $6.96 – Larger swing target from historical resistance.
4. 🚀 $16.92 – Mid-to-long term target if bullish momentum sustains.
5. 🎯 $32 – $43 – Potential long-term upside under extreme bullish conditions (not base scenario).
Bullish Confirmation Signs:
Weekly candle close above trendline + high volume
RSI breaks above 50 with momentum
Bitcoin remains stable or bullish
🔴 Bearish Scenario – If Rejected Again:
If UMA fails to break the trendline:
Price could drop back into support: $1.20 → $0.88
A breakdown below $0.88 would open the door to new all-time lows
Watch for wicks and volume drop as signs of weakness
When Is Breakout Considered Failed?
Strong rejection from $1.80–$1.90
Weekly close back below $1.20
Broader market (especially BTC) turns sharply bearish
🎯 Trader Strategy Outlook:
Swing traders: Wait for breakout confirmation and retest before entering.
Long-term investors: The $0.90–$1.20 range remains a solid accumulation zone with tight risk management.
Conservative traders: Avoid entry until a clear close above the descending trendline.
📌 Final Thoughts:
> UMA is now positioned at a major inflection point after two years of sideways compression. The chart structure shows clear signs of long-term accumulation, and a breakout could mark the beginning of a new bullish trend cycle. However, patience and confirmation are crucial — this is a setup worth watching, not chasing.
#UMAUSDT #UMA #CryptoBreakout #TechnicalAnalysis #DescendingTriangle #AltcoinSetup #SwingTradeOpportunity #CryptoAccumulation #BreakoutWatch #PriceAction
✅ Get Free Signals! Join Our Telegram Channel Here: t.me/TheCryptoNuclear
✅ Twitter: twitter.com/crypto_nuclear
✅ Join Bybit : partner.bybit.com/b/nuclearvip
✅ Benefits : Lifetime Trading Fee Discount -50%
✅ Twitter: twitter.com/crypto_nuclear
✅ Join Bybit : partner.bybit.com/b/nuclearvip
✅ Benefits : Lifetime Trading Fee Discount -50%
Disclaimer
The information and publications are not meant to be, and do not constitute, financial, investment, trading, or other types of advice or recommendations supplied or endorsed by TradingView. Read more in the Terms of Use.