UMAUSDT-Falling Wedge Formed#UMAUSDT 🔎🚀
-------------------------
⏰ Time Frame: 12H 🤑🤞
The Falling Wedge Pattern Breakout Has Already Done ✅😎
We am Expecting a Bullish Move of 70%🚀📈

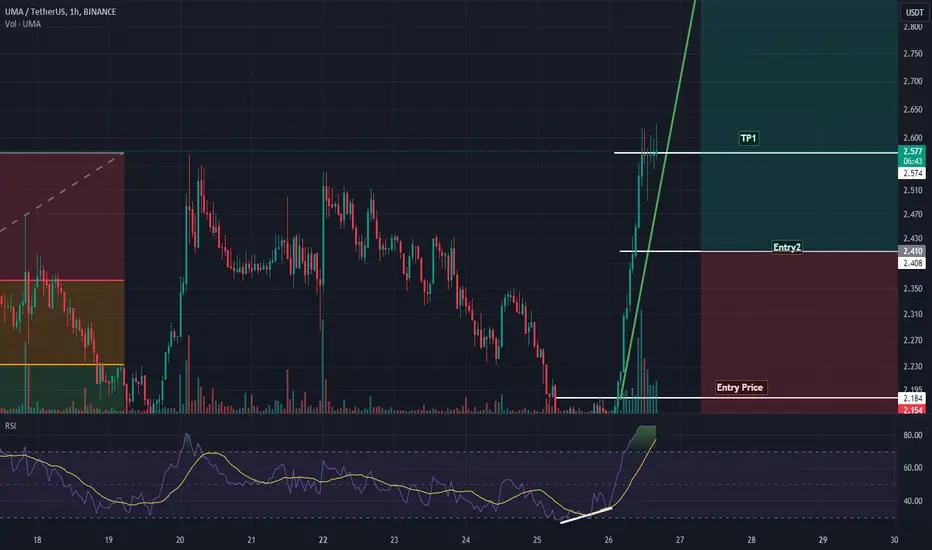
UMAUSDT Making Higher HIGH, It can go up to break the records???UMAUSDT make sign to buy at the bottom of the trend(Double Top)
Broken the Neckline and Starts making Higher High and Higher Low.
Trend it not over yet, IT has potential to break 3 ASAP.
I have shared the trading setup
UMAUSDT IDEAHey traders hope you are enjoying our analysis. Now we are here again with a new trading opportunity. We will discuss today about UMA
UMA The Falling wedge Breakout Has Already Confirmed Expecting 70% Bullish Rally In Coming Day's 🚀

UMAUSDT UPDATE #UMAUSDT
UPDATE
Hey dear traders hope you are enjoying trading and analysis with our team. we are here to discuss about UMAUSDT
UMA is making Falling wedge in 12h time frame ✅
I Expected massive Bullish wave towards 50%+ profit 📈

UMA's bearish trend line was broken !Trading Setup:
A Trading Signal is seen in the UMAUSDT UMA 4h (Futures)
Traders can open their Buy Trades NOW
⬆️Buy now or Buy on 2.101
⭕️SL @ 1.670
🔵TP1 @ 3.193
🔵TP2 @ 4.191
🔵TP3 @ 5.628
What are these signals based on?
Classical Technical Analysis
Price Action Candlesticks Fibonacci
RSI, Mo

UMA ANALYSIS (1D)Now we have more data on the chart and the scenario seems clearer.
From the place where we entered "start" on the chart, the UMA correction has started.
This correction seems to be a large diametric that we are now in wave E of this diametric.
If the price reaches the green range, we will look fo


UMA sell/short setupWe are looking for sell/short positions in the supply range.
The targets are marked on the chart.
At the bottom of the chart we have a lot of IFC moves.
Closing a daily candle above the invalidation level will violate the analysis
For risk management, please don't forget stop loss and capital ma

UMA LONG PLANUMA/USDT
Currently at discount zone of the P/D Range.
Holding at trendline Support + Weekly Demand Zone.
What next?
can pump from this level until holding above the support.
Invalidation.
weekly candle close below the demand zone..

Expected to hit the bottom of the channelThe overall trend for UMA is bearish. It ranges for a while, then makes a shadow upward move before continuing to drop. UMA is in a descending channel and continues its downward trend within this channel. The expected scenario is that UMA will hit the bottom of the channel and then move upward towar

See all ideas
Frequently Asked Questions
The current price of UMA / TetherUS (UMA) is 2.649 USDT — it has fallen 0.04% in the past 24 hours. Try placing this info into the context by checking out what coins are also gaining and losing at the moment and seeing UMA price chart.
UMA / TetherUS price has risen by 8.57% over the last week, its month performance shows a 0.46% increase, and as for the last year, UMA / TetherUS has increased by 60.55%. See more dynamics on UMA price chart.
Keep track of coins' changes with our Crypto heatmap.
Keep track of coins' changes with our Crypto heatmap.
UMA / TetherUS (UMA) reached its highest price on Feb 4, 2021 — it amounted to 43.998 USDT. Find more insights on the UMA price chart.
See the list of crypto gainers and choose what best fits your strategy.
See the list of crypto gainers and choose what best fits your strategy.
UMA / TetherUS (UMA) reached the lowest price of 1.224 USDT on Oct 19, 2023. View more UMA / TetherUS dynamics on the price chart.
See the list of crypto losers to find unexpected opportunities.
See the list of crypto losers to find unexpected opportunities.
The safest choice when buying UMA is to go to a well-known crypto exchange. Some of the popular names are Binance, Coinbase, Kraken. But you'll have to find a reliable broker and create an account first. You can trade UMA right from TradingView charts — just choose a broker and connect to your account.
Crypto markets are famous for their volatility, so one should study all the available stats before adding crypto assets to their portfolio. Very often it's technical analysis that comes in handy. We prepared technical ratings for UMA / TetherUS (UMA): today its technical analysis shows the buy signal, and according to the 1 week rating UMA shows the sell signal. And you'd better dig deeper and study 1 month rating too — it's sell. Find inspiration in UMA / TetherUS trading ideas and keep track of what's moving crypto markets with our crypto news feed.
UMA / TetherUS (UMA) is just as reliable as any other crypto asset — this corner of the world market is highly volatile. Today, for instance, UMA / TetherUS is estimated as 3.59% volatile. The only thing it means is that you must prepare and examine all available information before making a decision. And if you're not sure about UMA / TetherUS, you can find more inspiration in our curated watchlists.
You can discuss UMA / TetherUS (UMA) with other users in our public chats, Minds or in the comments to Ideas.