1. Historical Price Context & Trend Identification
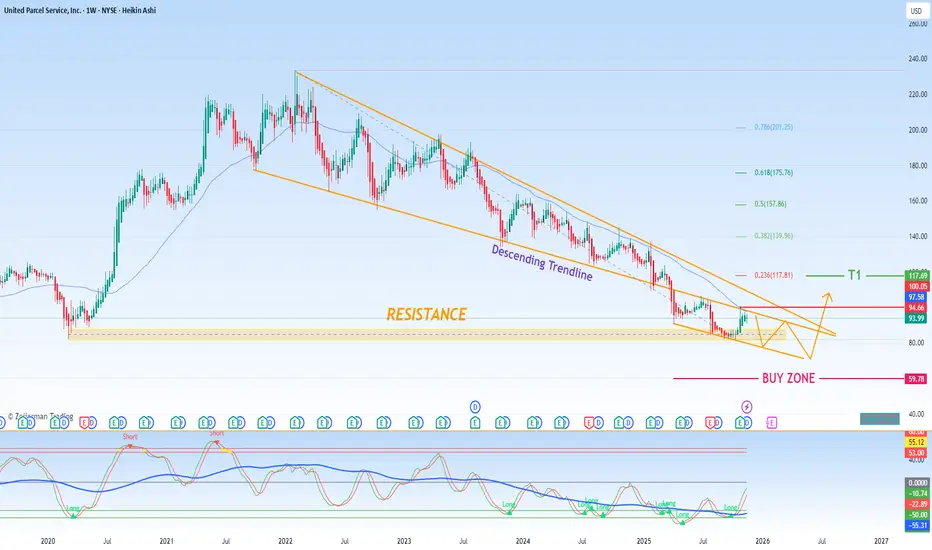
The long-term chart for UPS reveals a significant period of depreciation that initiated around Monday, October 4th, 2021. This established a clear and persistent downtrend. However, a critical technical development occurred on Monday, March 31st, 2025, when the price action conclusively broke above the primary descending trendline that had governed the stock's movement for over three years. This breakout is a technically significant event, as it suggests a potential exhaustion of the prior bearish momentum and a shift in market structure. While not a guarantee, this breach of a long-standing resistance line opens the possibility for a new, bullish phase to begin.
2. Key Technical Levels & Trading Strategy
Based on the current chart structure, we can identify several critical price levels that will be pivotal for determining the next major move.
Immediate Resistance: $80.00
This is the most critical short-term hurdle. A confirmed and sustained breakout above the $80.00 level, preferably on high volume, would serve as the strongest confirmation yet that the new bullish trend has validity. It would signal that buyer conviction is strong enough to overcome a key area of previous selling pressure.
Projection & Buy Zone: $60.00 - $70.00
It is important to manage expectations following a breakout. A common market behaviour is for the price to retrace back towards the newly established support level (the former descending trendline, now acting as support). This retracement offers a more optimal and lower-risk entry point. Therefore, our primary accumulation or buy zone is identified between $60.00 and $70.00. A pullback into this zone would be viewed as a healthy consolidation within the nascent bullish structure, providing a favourable risk-to-reward setup.
The "Red Line" Support: ~$100.00 (Re-evaluation Required)
Your mention of a "red line" at $100.00 is noted. Given the current price context (with the stock trading below $80), a move to $100 would actually represent a significant rally from current levels. Therefore, this level would likely act as a secondary profit-taking target or a resistance zone on the way up, rather than a buy zone. A more logical interpretation of a key support level to "buy" would be the newly formed ascending trendline or a significant moving average that aligns with the $60-$70 zone.
3. Profit-Taking Target
Upon a successful entry in the $60-$70 buy zone, with a confirmed hold of support, the initial medium-term profit-taking target is projected at the $120.00 level. This objective is based on measuring the potential impulse wave following the breakout from the long-term downtrend and aligns with a prior area of significant price history.
Summary & Outlook
In conclusion, the breakout on March 31st, 2025, is a constructive development for $UPS. The trading plan is as follows:
Wait for a pullback into the $60.00 - $70.00 zone for an optimal long entry.
Use a stop-loss below this zone (e.g., below $58.00) to manage risk in case the breakout fails.
Watch for a decisive break above $80.00 as confirmation of strengthening bullish momentum.
Take profits in stages as the price approaches the $120.00 target.
The long-term chart for
2. Key Technical Levels & Trading Strategy
Based on the current chart structure, we can identify several critical price levels that will be pivotal for determining the next major move.
Immediate Resistance: $80.00
This is the most critical short-term hurdle. A confirmed and sustained breakout above the $80.00 level, preferably on high volume, would serve as the strongest confirmation yet that the new bullish trend has validity. It would signal that buyer conviction is strong enough to overcome a key area of previous selling pressure.
Projection & Buy Zone: $60.00 - $70.00
It is important to manage expectations following a breakout. A common market behaviour is for the price to retrace back towards the newly established support level (the former descending trendline, now acting as support). This retracement offers a more optimal and lower-risk entry point. Therefore, our primary accumulation or buy zone is identified between $60.00 and $70.00. A pullback into this zone would be viewed as a healthy consolidation within the nascent bullish structure, providing a favourable risk-to-reward setup.
The "Red Line" Support: ~$100.00 (Re-evaluation Required)
Your mention of a "red line" at $100.00 is noted. Given the current price context (with the stock trading below $80), a move to $100 would actually represent a significant rally from current levels. Therefore, this level would likely act as a secondary profit-taking target or a resistance zone on the way up, rather than a buy zone. A more logical interpretation of a key support level to "buy" would be the newly formed ascending trendline or a significant moving average that aligns with the $60-$70 zone.
3. Profit-Taking Target
Upon a successful entry in the $60-$70 buy zone, with a confirmed hold of support, the initial medium-term profit-taking target is projected at the $120.00 level. This objective is based on measuring the potential impulse wave following the breakout from the long-term downtrend and aligns with a prior area of significant price history.
Summary & Outlook
In conclusion, the breakout on March 31st, 2025, is a constructive development for $UPS. The trading plan is as follows:
Wait for a pullback into the $60.00 - $70.00 zone for an optimal long entry.
Use a stop-loss below this zone (e.g., below $58.00) to manage risk in case the breakout fails.
Watch for a decisive break above $80.00 as confirmation of strengthening bullish momentum.
Take profits in stages as the price approaches the $120.00 target.
Disclaimer
The information and publications are not meant to be, and do not constitute, financial, investment, trading, or other types of advice or recommendations supplied or endorsed by TradingView. Read more in the Terms of Use.
Disclaimer
The information and publications are not meant to be, and do not constitute, financial, investment, trading, or other types of advice or recommendations supplied or endorsed by TradingView. Read more in the Terms of Use.