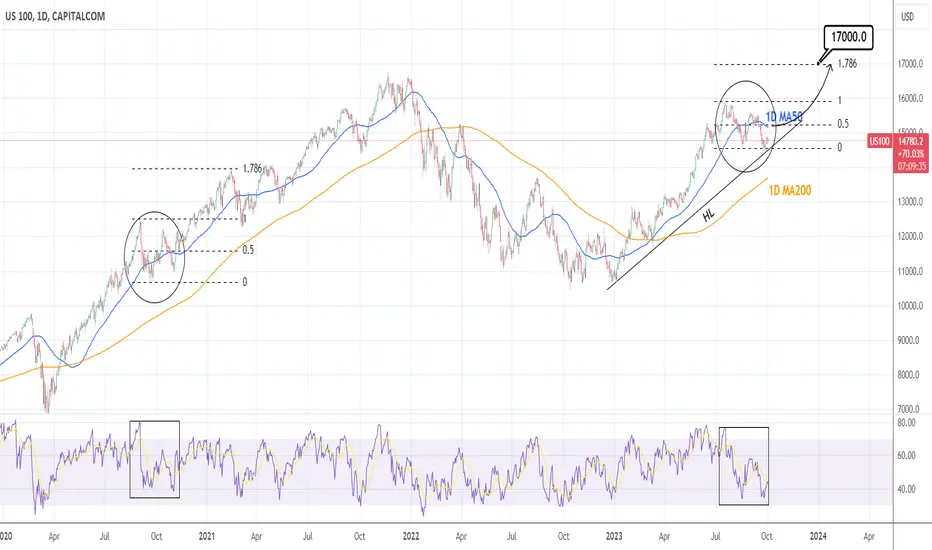
Nasdaq remains bearish on the 1D timeframe (RSI = 40.412, MACD = -138.180, ADX = 35.654) but it is on the HL trendline, the supporting trendline that emerged on the December 28th 2022 low. According to the 1D RSI, comparisons can be made with the September-October 2020 consolidation fractal around the 1D MA50, following the COVID recovery. After the 1D MA50 got crossed over for the second time, the index went on to reach the 1.786 Fibonacci extension level before the next consolidation.
If the HL holds and the index breaks over the 1D MA50 again, we will have a strong long term bullish case in our hands and target 17,000 (Fibonacci 1.786).
## If you like our free content follow our profile to get more daily ideas. ##
## Comments and likes are greatly appreciated. ##
If the HL holds and the index breaks over the 1D MA50 again, we will have a strong long term bullish case in our hands and target 17,000 (Fibonacci 1.786).
## If you like our free content follow our profile to get more daily ideas. ##
## Comments and likes are greatly appreciated. ##
Telegram: t.me/investingscope
investingscope.com
Over 65% accuracy on Private Signals Channel.
Over 15% return monthly on our Account Management Plan.
Account RECOVERY services.
Free Channel: t.me/investingscopeofficial
investingscope.com
Over 65% accuracy on Private Signals Channel.
Over 15% return monthly on our Account Management Plan.
Account RECOVERY services.
Free Channel: t.me/investingscopeofficial
Disclaimer
The information and publications are not meant to be, and do not constitute, financial, investment, trading, or other types of advice or recommendations supplied or endorsed by TradingView. Read more in the Terms of Use.