Over the past two trading sessions, the Dow Jones index has declined by just over 0.7%, with selling pressure remaining constant. This move has been tied to the rebound in U.S. 10-year Treasury yields, which climbed to 4.27%, reducing the short-term appeal of equities. In addition, investors are awaiting the release of U.S. employment data at the end of the week, as the results could influence the Federal Reserve’s upcoming policy decisions.
Uptrend Remains Intact
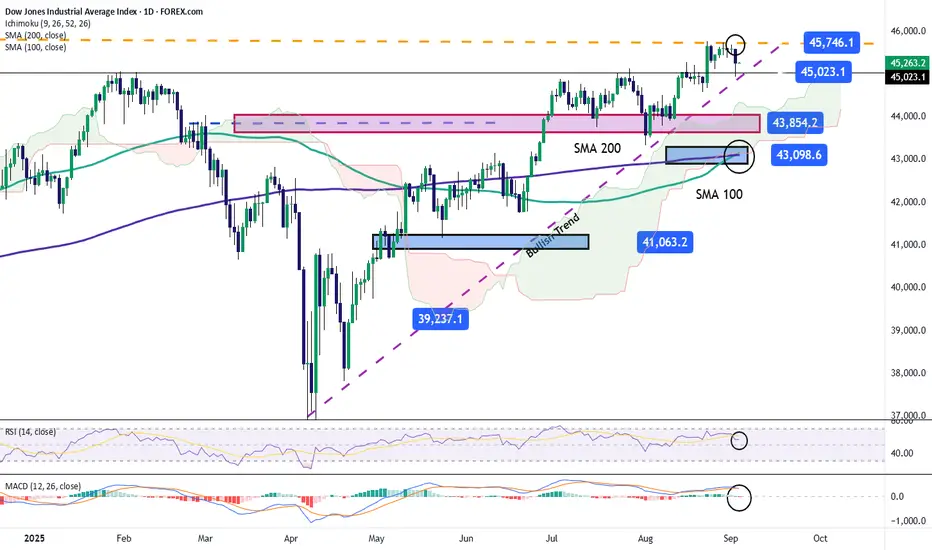
Despite the recent pullback, the short-term declines have not been strong enough to break the uptrend that has remained in place for the past several months. This technical structure continues to be the most relevant in the short term. Unless selling pressure consolidates over more sessions, the upward trend is likely to remain dominant in the coming days.
Technical Indicators
RSI: although the RSI remains above the 50 level, it has begun to show a downward slope in the short term, which could indicate a shift in market momentum. If the line continues to decline, selling pressure could become more relevant in the sessions ahead.
MACD: the MACD histogram continues to hover around the 0 line, indicating that the average strength of the moving averages remains in neutral territory. This highlights the lack of clear direction in the short term.
Key Levels to Watch:
Written by Julian Pineda, CFA – Market Analyst
Uptrend Remains Intact
Despite the recent pullback, the short-term declines have not been strong enough to break the uptrend that has remained in place for the past several months. This technical structure continues to be the most relevant in the short term. Unless selling pressure consolidates over more sessions, the upward trend is likely to remain dominant in the coming days.
Technical Indicators
RSI: although the RSI remains above the 50 level, it has begun to show a downward slope in the short term, which could indicate a shift in market momentum. If the line continues to decline, selling pressure could become more relevant in the sessions ahead.
MACD: the MACD histogram continues to hover around the 0 line, indicating that the average strength of the moving averages remains in neutral territory. This highlights the lack of clear direction in the short term.
Key Levels to Watch:
- 45,746 points – Relevant Resistance: corresponds to the Dow Jones record highs. A sustained breakout above this level could pave the way for a continuation of the uptrend.
- 45,023 points – Near-Term Support: coincides with recent lows and may act as a barrier for potential short-term pullbacks.
- 43,098 points – Critical Support: aligns with the 100- and 200-period simple moving averages. A move down to this zone could confirm a break in the uptrend and give way to a dominant bearish bias.
Written by Julian Pineda, CFA – Market Analyst
Disclaimer
The information and publications are not meant to be, and do not constitute, financial, investment, trading, or other types of advice or recommendations supplied or endorsed by TradingView. Read more in the Terms of Use.
Disclaimer
The information and publications are not meant to be, and do not constitute, financial, investment, trading, or other types of advice or recommendations supplied or endorsed by TradingView. Read more in the Terms of Use.