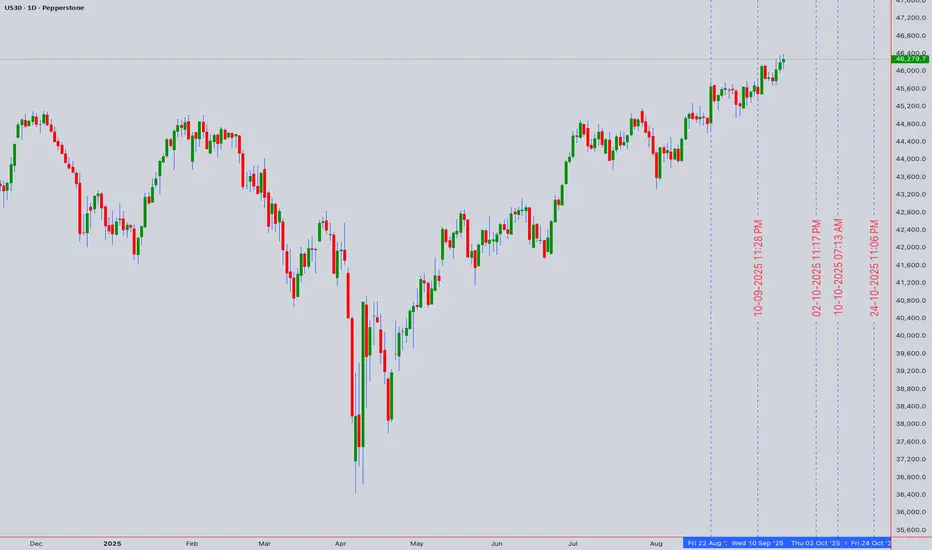
📊 US30 (Dow Jones CFD) Forecast 🔮
Closing Price: 46,279.7 (20th Sept 2025, 12:50 AM UTC+4)
🔥 Technical Outlook (Intraday + Swing)
⏱ Intraday Analysis (5m – 4H)
📆 Swing Trading Analysis (Daily – Weekly)
📚 Methodology Applied
⚖️ Market Context
⚠️ Note: This analysis is for educational purposes 📚. Trade with discipline, risk management, and DYOR 🔍.
For individuals seeking to enhance their trading abilities based on the analyses provided, I recommend exploring the mentoring program offered by Shunya Trade. (Website: shunya dot trade)
I would appreciate your feedback on this analysis, as it will serve as a valuable resource for future endeavors.
Sincerely,
Shunya.Trade
Website: shunya dot trade
📝 TRADING CHECKLIST
Before entering any position:
- ✅ Confirm volume supports move
- ✅ Check RSI for divergences
- ✅ Verify multiple timeframe alignment
- ✅ Set stop loss before entry
- ✅ Calculate position size
- ✅ Review correlation with DXY/SPX
- ✅ Check economic calendar
- ✅ Assess market sentiment
⚠️Disclaimer: This post is intended solely for educational purposes and does not constitute investment advice, financial advice, or trading recommendations. The views expressed herein are derived from technical analysis and are shared for informational purposes only. The stock market inherently carries risks, including the potential for capital loss. Therefore, readers are strongly advised to exercise prudent judgment before making any investment decisions. We assume no liability for any actions taken based on this content. For personalized guidance, it is recommended to consult a certified financial advisor.
Closing Price: 46,279.7 (20th Sept 2025, 12:50 AM UTC+4)
🔥 Technical Outlook (Intraday + Swing)
⏱ Intraday Analysis (5m – 4H)
✅ Buy Zone: 46,050 – 46,150 🎯
🚀 Upside Targets: 46,420 → 46,580 → 46,750 🏆
❌ Sell Zone: 46,600 – 46,700 📉
📉 Downside Targets: 46,380 → 46,200 → 45,950 ⚠️
🔔 Watch for MA Golden Cross & VWAP bounce intraday.
📆 Swing Trading Analysis (Daily – Weekly)
🛡 Major Support: 45,800 – 45,500 🪙
📈 Swing Buy Entry: 45,600 – 45,800
🎯 Swing Bullish Targets: 46,950 → 47,320 → 47,900 🌟
📉 Swing Sell Entry: Below 45,480 ❗
🎯 Swing Bearish Targets: 45,200 → 44,780 → 44,350 🕳
📚 Methodology Applied
📌 Chart Patterns: Head & Shoulders ⚠️, potential Bull Trap 🚨.
📌 Harmonics & Fib Levels: 0.618 pullback aligns near 45,950.
📌 Elliott Wave Count: Wave 3 extension may still be active 🔄.
📌 Ichimoku Cloud: Price above Kumo = bullish bias ☁️✅.
📌 Wyckoff: Distribution signals visible at 46,700 zone 🏦.
📌 RSI: 63 intraday → nearing overbought, but not extreme.
📌 Bollinger Bands: Upper band hit near 46,750 = resistance 🎯.
📌 VWAP: Anchored VWAP support ~46,100 = key intraday pivot.
⚖️ Market Context
📰 US Fed stance & inflation numbers remain catalysts.
🌍 Geopolitical tensions add volatility risk.
💵 Dollar Index strength can cap upside.
🎯 Trading Plan Summary
📊 Intraday Bias: Range-bound → Scalps between 46,100 – 46,700.
🚀 Swing Bias: Bullish above 45,800, bearish below 45,500.
🔑 Risk Mgmt: Always apply SL 80–120 pts (intraday) & 200–300 pts (swing).
⚠️ Note: This analysis is for educational purposes 📚. Trade with discipline, risk management, and DYOR 🔍.
For individuals seeking to enhance their trading abilities based on the analyses provided, I recommend exploring the mentoring program offered by Shunya Trade. (Website: shunya dot trade)
I would appreciate your feedback on this analysis, as it will serve as a valuable resource for future endeavors.
Sincerely,
Shunya.Trade
Website: shunya dot trade
📝 TRADING CHECKLIST
Before entering any position:
- ✅ Confirm volume supports move
- ✅ Check RSI for divergences
- ✅ Verify multiple timeframe alignment
- ✅ Set stop loss before entry
- ✅ Calculate position size
- ✅ Review correlation with DXY/SPX
- ✅ Check economic calendar
- ✅ Assess market sentiment
⚠️Disclaimer: This post is intended solely for educational purposes and does not constitute investment advice, financial advice, or trading recommendations. The views expressed herein are derived from technical analysis and are shared for informational purposes only. The stock market inherently carries risks, including the potential for capital loss. Therefore, readers are strongly advised to exercise prudent judgment before making any investment decisions. We assume no liability for any actions taken based on this content. For personalized guidance, it is recommended to consult a certified financial advisor.
I am nothing @shunya.trade
Disclaimer
The information and publications are not meant to be, and do not constitute, financial, investment, trading, or other types of advice or recommendations supplied or endorsed by TradingView. Read more in the Terms of Use.
I am nothing @shunya.trade
Disclaimer
The information and publications are not meant to be, and do not constitute, financial, investment, trading, or other types of advice or recommendations supplied or endorsed by TradingView. Read more in the Terms of Use.