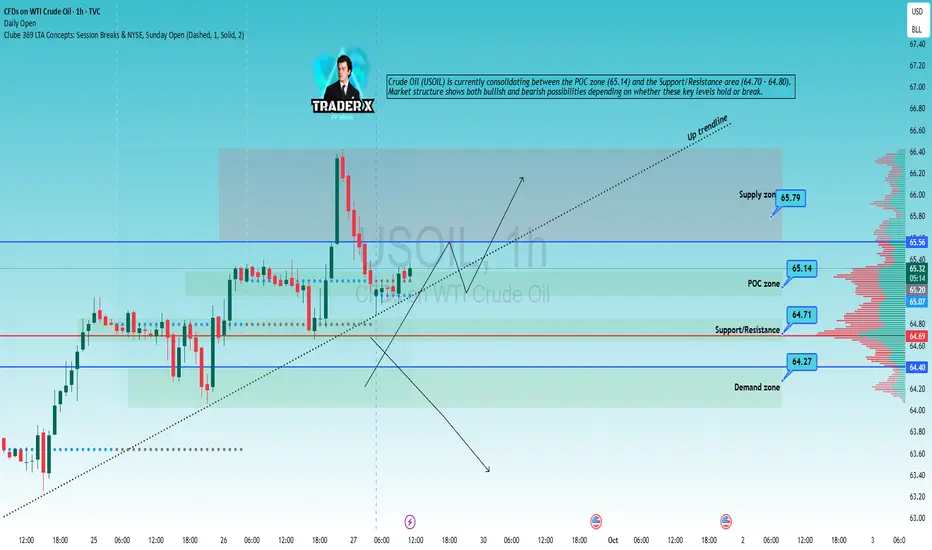
Crude Oil (USOIL) is currently consolidating between the POC zone (65.14) and the Support/Resistance area (64.70 – 64.80). Market structure shows both bullish and bearish possibilities depending on whether these key levels hold or break
Here are 4 possible scenarios with entry signals to watch:
📊 Scenario 1 – Rebound from Support/Resistance
Watch zone: 64.70 – 64.80 (Support/Resistance).
Price action: Bullish reversal candlestick (Pin bar, Bullish engulfing) with volume confirmation.
Trading signal:
👉 Buy around 64.70 – 64.80
🎯 TP1: 65.14 (POC zone)
🎯 TP2: 65.56 – 65.79 (Supply zone)
⛔ SL: below 64.40 (Demand zone).
📊 Scenario 2 – Breakout above Supply Zone
Watch zone: 65.56 – 65.79 (Supply zone).
Price action: H1 candle closes above 65.80 with strong volume.
Trading signal:
👉 Buy breakout above 65.80
🎯 TP1: 66.20
🎯 TP2: 66.80
⛔ SL: below 65.40.
📊 Scenario 3 – Breakdown of Support/Resistance
Watch zone: 64.70 – 64.80.
Price action: H1 candle closes below 64.70 with strong bearish momentum.
Trading signal:
👉 Sell on pullback to 64.70
🎯 TP1: 64.40 (Demand zone)
🎯 TP2: 63.80
⛔ SL: above 65.10.
📊 Scenario 4 – Breakdown of Demand Zone
Watch zone: 64.20 – 64.40 (Demand zone).
Price action: H1 candle closes below 64.20 with increasing volume.
Trading signal:
👉 Sell breakout below 64.20
🎯 TP1: 63.60
🎯 TP2: 63.00
⛔ SL: above 64.60.
👉 Summary:
Holding above 64.70 favors Buy setups.
Breaking below 64.70 favors Sell setups.
Key short-term battle zone: 65.56 – 65.79 Supply area.
⚠️ Disclaimer:
This analysis is for educational and informational purposes only and should not be considered financial advice. Trading in financial markets involves significant risk, and you should only trade with capital you can afford to lose. Always do your own research before making any trading decisions.
Related publications
Disclaimer
The information and publications are not meant to be, and do not constitute, financial, investment, trading, or other types of advice or recommendations supplied or endorsed by TradingView. Read more in the Terms of Use.
Related publications
Disclaimer
The information and publications are not meant to be, and do not constitute, financial, investment, trading, or other types of advice or recommendations supplied or endorsed by TradingView. Read more in the Terms of Use.