The Silver market has been chopping around between $50 at $8.5 for the last 20 years but has been following the methodology I call "Time At Mode" from the observation that markets tend to trend for the same amount of time as the most common price across an accumulation level (or distribution level).
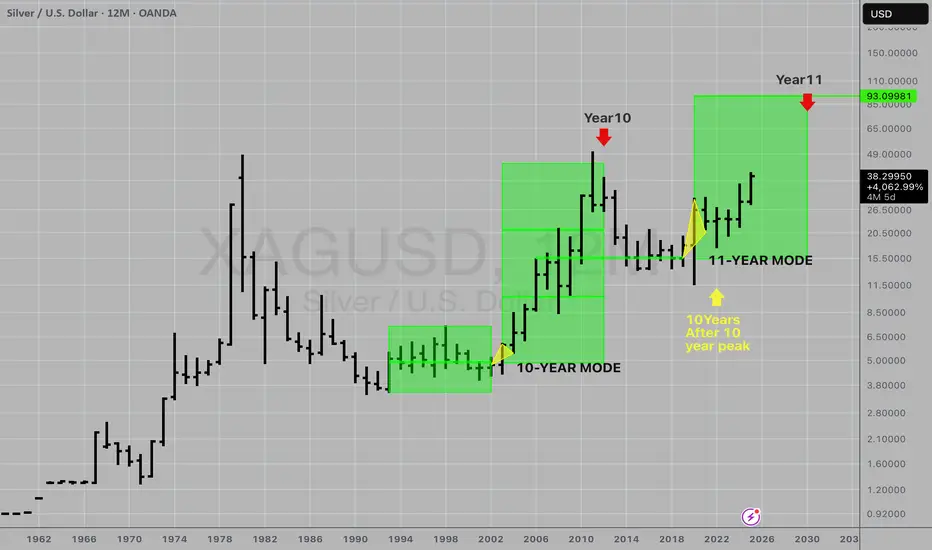
As you can see here with Silver, from 1993 to 2002, it went sideways and every year touched the $5 level and if you look carefully the "highest low" was in 1999 at $4.87. That is the official mode for the uptrend starting from the low in 1991.
Why did the uptrend start in 1991? 1991 was the lowest low for the following 5 bars, so we can methodically label the 1991 low the "start" of the uptrend. Counting forward from 1991 we can see the wide range from $4 to $7 across the following 10 years.
In 2003 I have marked a "range expansion" bar where the advance to the high that year was greater than the previous year's range. That "range expansion" is the sign of a change in the market and a signal that the market has detached from the mode and is ready to trend. What I have noticed is that the market will trend for the same number of bars as touch one single price line across the mode.
The 10th year wasn't the highest high of the uptrend of 10 years, but it was the "highest low" for the uptrend. You can also notice that the price moved up by 3x the range around the mode. The "range" is the highest to lowest measurement of those bars that between the start and end of the mode line.
By adding the "RAM" (range around mode) to the mode, you establish a likely price target for the trend. In this case, silver moved 3x the RAM or Range.
Since the peak in silver in 2011, silver has built a new mode at the $15 level and it too started to trend in 2019 by Range Expanding but then 2020 reversed that jump start and stopped out that signal.
2020 again saw a range expansion out of the mode and triggered a new 11-year uptrend which is labeled now ending in 2030.
The upside target is measured using a %-graph and measuring from $8.458 in 2008 to the high in 2011 at $48.8 and using that % to project up from the mode at $15.1897, which is the low of the year 2017.
So, the target is for $93 by the year 2030 which sounds impressive but is a bit over 143% spread out over 5 years for a compound gain of 19.5% per year.
The typical way to trade Timemode is to hold 2 positions, one to exit when the price target is hit and one to exit when the time expires.
See you in 2030 to see if this trade panned out.
Cheers,
Tim
8/27/2025 10:39AM EST
Trade active
Here is the quarterly time frame for this trend on the yearly.
The quarterly trend is also very clear and there are 8 bars remaining in the trend and the price reached the "range-around-mode, added to the mode" target today.
Stay tuned!
Tim
9/8/2025 11:19AM EST
Subscribe to my indicator package KEY HIDDEN LEVELS $10/mo or $100/year and join me in the trading room KEY HIDDEN LEVELS here at TradingView.com
Disclaimer
The information and publications are not meant to be, and do not constitute, financial, investment, trading, or other types of advice or recommendations supplied or endorsed by TradingView. Read more in the Terms of Use.
Disclaimer
The information and publications are not meant to be, and do not constitute, financial, investment, trading, or other types of advice or recommendations supplied or endorsed by TradingView. Read more in the Terms of Use.