Gold Daily Chart – Final Week of August
Hello traders, let’s take a look at the gold outlook for the coming week.
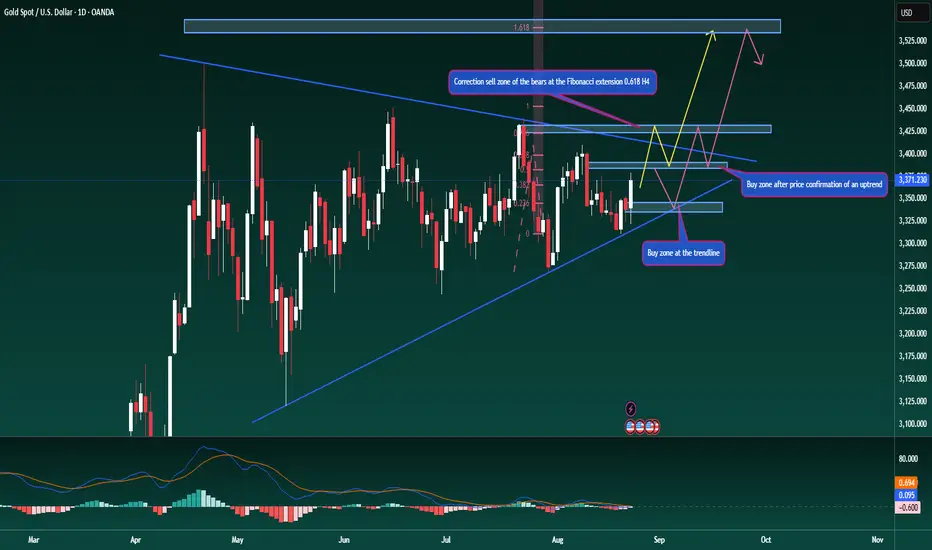
Gold has continued to rally strongly after touching the ascending trendline on the D1 chart, in line with the outlook shared earlier. This bounce also makes the triangle pattern more valid. For the week ahead, trading is expected to remain within the 3330–3410 range, giving about 80 dollars of movement.
While the longer-term expectation is for gold to move towards fresh ATH levels, this will first require a confirmed breakout from the triangle. Once that happens, a minor pullback could occur before the next leg higher (as illustrated on my chart).
On the H4 chart, Friday’s rally has allowed us to plot a Fibonacci Extension, highlighting 3390 and 3430 as potential upside levels. These areas may act as short-term selling opportunities, driven by profit-taking from buyers.
On the daily timeframe, a successful breakout from the triangle could push gold towards 3540, marking a new ATH – this is the long-term scenario. On the other hand, if price pulls back, the ascending trendline near 3341 remains a logical level to consider fresh long positions.
Also note that this is the last week of August. On Friday, a liquidity grab is possible as large players rebalance and settle positions before month-end, so extra caution is advised.
This is my personal outlook for XAUUSD in the week ahead. I hope it provides value in shaping your trading plans.
What’s your view on gold right now? Share your thoughts in the comments so we can learn from each other.
Hello traders, let’s take a look at the gold outlook for the coming week.
Gold has continued to rally strongly after touching the ascending trendline on the D1 chart, in line with the outlook shared earlier. This bounce also makes the triangle pattern more valid. For the week ahead, trading is expected to remain within the 3330–3410 range, giving about 80 dollars of movement.
While the longer-term expectation is for gold to move towards fresh ATH levels, this will first require a confirmed breakout from the triangle. Once that happens, a minor pullback could occur before the next leg higher (as illustrated on my chart).
On the H4 chart, Friday’s rally has allowed us to plot a Fibonacci Extension, highlighting 3390 and 3430 as potential upside levels. These areas may act as short-term selling opportunities, driven by profit-taking from buyers.
On the daily timeframe, a successful breakout from the triangle could push gold towards 3540, marking a new ATH – this is the long-term scenario. On the other hand, if price pulls back, the ascending trendline near 3341 remains a logical level to consider fresh long positions.
Also note that this is the last week of August. On Friday, a liquidity grab is possible as large players rebalance and settle positions before month-end, so extra caution is advised.
This is my personal outlook for XAUUSD in the week ahead. I hope it provides value in shaping your trading plans.
What’s your view on gold right now? Share your thoughts in the comments so we can learn from each other.
Related publications
Disclaimer
The information and publications are not meant to be, and do not constitute, financial, investment, trading, or other types of advice or recommendations supplied or endorsed by TradingView. Read more in the Terms of Use.
Related publications
Disclaimer
The information and publications are not meant to be, and do not constitute, financial, investment, trading, or other types of advice or recommendations supplied or endorsed by TradingView. Read more in the Terms of Use.