Market Context
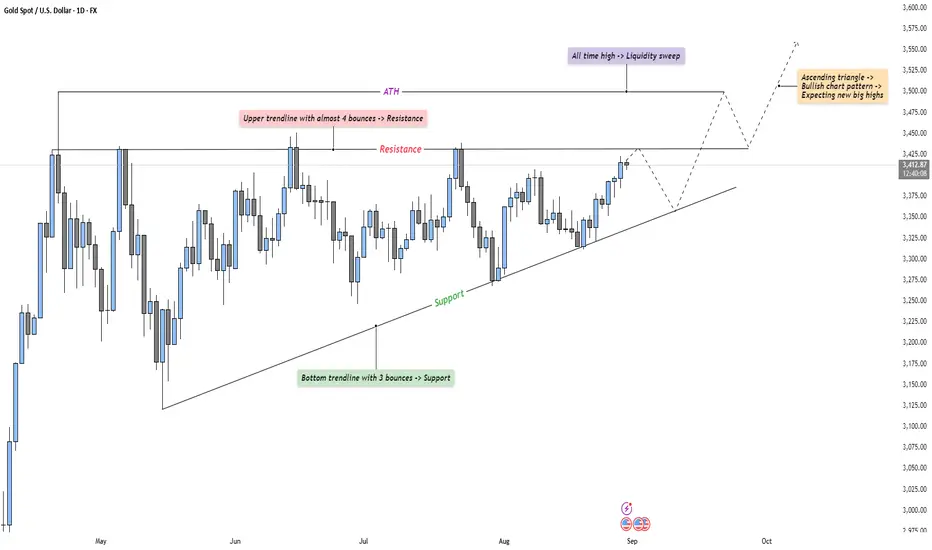
Gold has been steadily climbing, forming an ascending triangle pattern over the past few months. Buyers continue to defend higher lows, while sellers repeatedly reject price near resistance. This type of structure often signals building pressure, with volatility likely to expand once a breakout occurs.
Consolidation Phase
The range between the ascending support trendline and the horizontal resistance has created a textbook consolidation. Each bounce off support shows accumulation, while the repeated touches of resistance highlight where liquidity is building. The longer price compresses within this pattern, the more explosive the eventual breakout is expected to be.
Bullish Breakout Scenario
If price manages to break above resistance and sweep the all-time high, it would likely trigger a wave of liquidity from trapped shorts and breakout buyers entering. This move could fuel momentum into fresh price discovery, validating the ascending triangle as a bullish continuation pattern. The sweep of liquidity above ATH could serve as the catalyst for acceleration toward new highs.
Bearish Retest Scenario
On the other hand, if resistance holds once again, a deeper retracement back toward the ascending trendline is likely. This would test the conviction of buyers and determine whether the trendline support continues to act as the foundation for the structure. A clean break below support would weaken the bullish outlook and signal a potential shift in momentum.
Final Words
Patience here is key — ascending triangles often test traders’ resolve before making their decisive move. Let the market reveal its hand before committing to either direction.
If you found this breakdown helpful, a like would be much appreciated! Drop a comment and let me know: are you expecting the breakout to bring new highs, or do you see sellers defending this level once again?
Note
Are you also bullish on gold?Trade active
Looks like we will have to wait for Monday! Let’s see if we break out…Trade closed: target reached
Tomorrow the charts will be moving again! Let’s see…MY LINKS
📈 Free Signals
bit.ly/3YxiRXr
💬 Discord Community
bit.ly/4jHHA3O
💵 Favorite Exchange
bit.ly/4lBeTXt
📈 Free Signals
bit.ly/3YxiRXr
💬 Discord Community
bit.ly/4jHHA3O
💵 Favorite Exchange
bit.ly/4lBeTXt
Disclaimer
The information and publications are not meant to be, and do not constitute, financial, investment, trading, or other types of advice or recommendations supplied or endorsed by TradingView. Read more in the Terms of Use.
MY LINKS
📈 Free Signals
bit.ly/3YxiRXr
💬 Discord Community
bit.ly/4jHHA3O
💵 Favorite Exchange
bit.ly/4lBeTXt
📈 Free Signals
bit.ly/3YxiRXr
💬 Discord Community
bit.ly/4jHHA3O
💵 Favorite Exchange
bit.ly/4lBeTXt
Disclaimer
The information and publications are not meant to be, and do not constitute, financial, investment, trading, or other types of advice or recommendations supplied or endorsed by TradingView. Read more in the Terms of Use.