📊  XLM Weekly Market Update – Long Setup
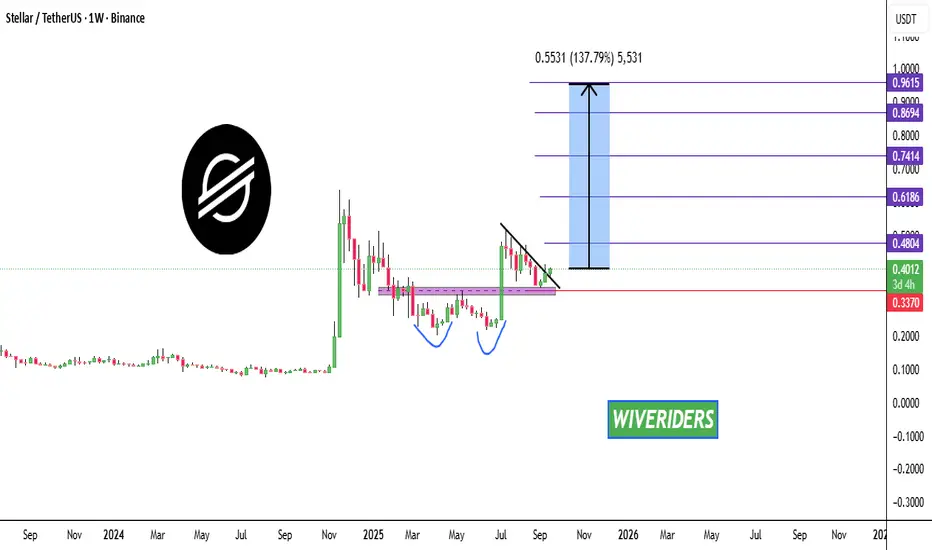
As we can see on the weekly chart,XLM has formed a bullish double bottom pattern ✅
👉 After the pullback, it broke out of the black resistance zone, confirming a bullish structure.
🔼 Trade Idea:
📈 Entry Price (Current): 0.4002
🎯 Targets:
Target 1 → 0.4804
Target 2 → 0.6186
Target 3 → 0.7414
Target 4 → 0.8694
Target 5 → 0.9615
🛑 Stop Loss: 0.3370
⚠️ Risk: ~15.80%
💰 Potential Reward: ~140.19%
📊 Risk/Reward Ratio: ~8.87
📌 Trade Type: Long
👉 If you’re holdingXLM, these are the weekly targets & stop-loss to watch.
As we can see on the weekly chart,
👉 After the pullback, it broke out of the black resistance zone, confirming a bullish structure.
🔼 Trade Idea:
📈 Entry Price (Current): 0.4002
🎯 Targets:
Target 1 → 0.4804
Target 2 → 0.6186
Target 3 → 0.7414
Target 4 → 0.8694
Target 5 → 0.9615
🛑 Stop Loss: 0.3370
⚠️ Risk: ~15.80%
💰 Potential Reward: ~140.19%
📊 Risk/Reward Ratio: ~8.87
📌 Trade Type: Long
👉 If you’re holding
Disclaimer
The information and publications are not meant to be, and do not constitute, financial, investment, trading, or other types of advice or recommendations supplied or endorsed by TradingView. Read more in the Terms of Use.
Disclaimer
The information and publications are not meant to be, and do not constitute, financial, investment, trading, or other types of advice or recommendations supplied or endorsed by TradingView. Read more in the Terms of Use.