1. When Breakouts Lie
Few things in trading are more exciting than a clean breakout. But for every breakout that soars, there’s another that fakes out and traps eager traders.
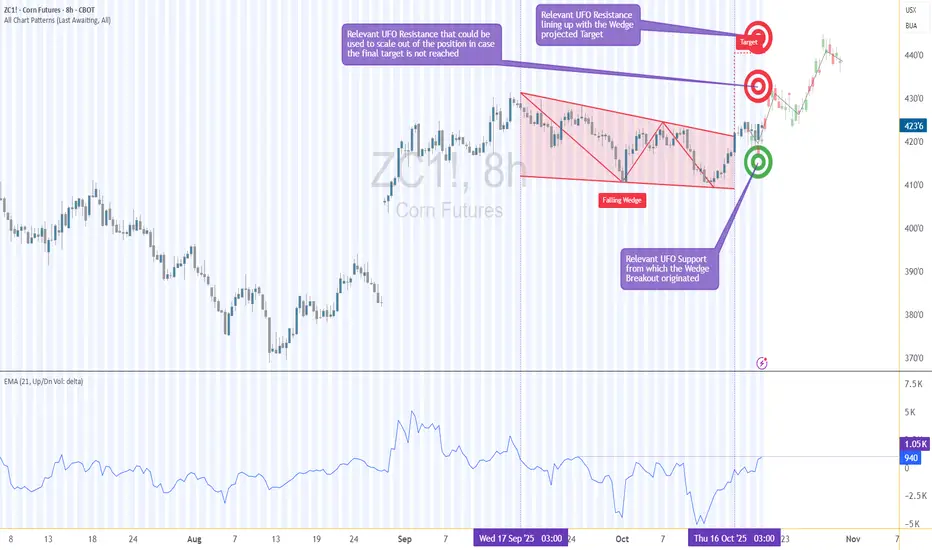
Corn Futures (ZC) on the 8-hour chart just gave us that classic test — a breakout from a falling wedge that has traders asking: Is this the real thing, or another false alarm?
The pattern looks textbook. Price compressed lower within a wedge and broke above its upper trendline. However, the true strength of any breakout lies not in the pattern itself, but in the story told by volume and order flow. That’s what we’ll unpack in this article — using ZC (Corn Futures) and MZC (Micro Corn Futures) as our guide.
2. The Falling Wedge in Focus
Falling wedges often represent market exhaustion, where selling pressure slows and buyers quietly begin to accumulate positions. On the Corn Futures 8-hour chart, price has indeed pushed beyond the wedge’s descending resistance line — the visual signal that usually excites breakout traders.
But structure alone doesn’t make a sustainable move. Beneath the surface, the UFO support and resistance levels — zones of UnFilled Orders — provide the invisible scaffolding that can support or reject price movement.
In this case:
These areas represent pending potential new support and resistance areas where buy and sell orders that can act as launchpads or barriers. The key is to see how the market interacts with them while volume builds or fades.
3. The Volume Delta Story
Here’s where things get interesting.
Volume Delta — the difference between buy and sell volume — shows us who’s winning the tug-of-war between buyers and sellers.
During the wedge formation, the maximum delta reached +1.05K, indicating meaningful buying activity despite the downtrend. But as the breakout unfolded, delta turned slightly negative. In plain terms, fewer new buyers are stepping in — and without new buying energy, breakouts often lose traction.
That’s a classic setup for a potential fake-out: price pokes above the wedge, but order flow doesn’t confirm. This mismatch between technical breakout and volume delta is often the canary in the coal mine for fading momentum.
4. The Trade Logic — Let the Market Come to You
Instead of chasing the breakout, the smarter play here could be to wait for the market to revisit demand/support.
Why? Because that’s where new volume tends to enter — where pending buy orders (the UFOs) become filled, strengthening the delta and giving the move fresh fuel.
A potential plan might look like this:
This setup maintains a clear reward-to-risk ratio above 3:1, assuming disciplined execution and volatility-adjusted sizing. It’s not about prediction — it’s about preparation. Waiting for retracement allows participation in a confirmed move, rather than reacting to emotional excitement at the breakout.
5. Contract Specifications & Margin Requirements
Understanding your instrument is as important as reading your chart.
Here’s what traders should know about these CME-listed Corn contracts:
ZC – Corn Futures (Standard Contract)
MZC – Micro Corn Futures
Micro contracts allow smaller-scale traders to apply the same analysis and structure as the full-size contract, but with controlled risk exposure — a major advantage for capital management.
6. When New Volume is Injected in the Market
Think of Volume Delta as a glance in the rear-view mirror — it tells us what’s already been filled. On the other hand, analyzing support and resistance levels with the idea of where new unfilled orders might come in helps us prepare to enter trades just before momentum potentially reactivates.
When both are combined:
7. Risk Management — Protect Before You Project
Every solid trade plan starts with a stop.
For this setup, a logical stop below 411 ensures protection if the wedge breakout fails completely.
Scaling out at 430 reduces exposure early, locking gains in case the move stalls.
Always size positions relative to account equity and volatility — the most underrated edge in trading is survival.
The best traders don’t just hunt profits — they hunt consistency. Managing risk transforms a potentially stressful market environment into a structured decision process.
8. CME Context & Final Thoughts
Both ZC and MZC are cornerstone agricultural contracts traded on the CME Group’s CBOT exchange, giving traders exposure to one of the world’s most economically significant commodities.
While the setup we’ve explored is a case study, the takeaway extends beyond Corn:
Breakouts need participation. Volume confirms conviction. Key support and resistance levels reveal intention.
In markets where fake-outs are common, aligning technical structure, order flow, and patient trade planning gives traders the clearest edge of all — confidence grounded in data, not emotion.
When charting futures, the data provided could be delayed. Traders working with the ticker symbols discussed in this idea may prefer to use CME Group real-time data plan on TradingView: tradingview.com/cme/ - This consideration is particularly important for shorter-term traders, whereas it may be less critical for those focused on longer-term trading strategies.
General Disclaimer:
The trade ideas presented herein are solely for illustrative purposes forming a part of a case study intended to demonstrate key principles in risk management within the context of the specific market scenarios discussed. These ideas are not to be interpreted as investment recommendations or financial advice. They do not endorse or promote any specific trading strategies, financial products, or services. The information provided is based on data believed to be reliable; however, its accuracy or completeness cannot be guaranteed. Trading in financial markets involves risks, including the potential loss of principal. Each individual should conduct their own research and consult with professional financial advisors before making any investment decisions. The author or publisher of this content bears no responsibility for any actions taken based on the information provided or for any resultant financial or other losses.
Few things in trading are more exciting than a clean breakout. But for every breakout that soars, there’s another that fakes out and traps eager traders.
Corn Futures (ZC) on the 8-hour chart just gave us that classic test — a breakout from a falling wedge that has traders asking: Is this the real thing, or another false alarm?
The pattern looks textbook. Price compressed lower within a wedge and broke above its upper trendline. However, the true strength of any breakout lies not in the pattern itself, but in the story told by volume and order flow. That’s what we’ll unpack in this article — using ZC (Corn Futures) and MZC (Micro Corn Futures) as our guide.
2. The Falling Wedge in Focus
Falling wedges often represent market exhaustion, where selling pressure slows and buyers quietly begin to accumulate positions. On the Corn Futures 8-hour chart, price has indeed pushed beyond the wedge’s descending resistance line — the visual signal that usually excites breakout traders.
But structure alone doesn’t make a sustainable move. Beneath the surface, the UFO support and resistance levels — zones of UnFilled Orders — provide the invisible scaffolding that can support or reject price movement.
In this case:
- Support Zone: 418–411
- Resistance Levels: 430 and 442
These areas represent pending potential new support and resistance areas where buy and sell orders that can act as launchpads or barriers. The key is to see how the market interacts with them while volume builds or fades.
3. The Volume Delta Story
Here’s where things get interesting.
Volume Delta — the difference between buy and sell volume — shows us who’s winning the tug-of-war between buyers and sellers.
During the wedge formation, the maximum delta reached +1.05K, indicating meaningful buying activity despite the downtrend. But as the breakout unfolded, delta turned slightly negative. In plain terms, fewer new buyers are stepping in — and without new buying energy, breakouts often lose traction.
That’s a classic setup for a potential fake-out: price pokes above the wedge, but order flow doesn’t confirm. This mismatch between technical breakout and volume delta is often the canary in the coal mine for fading momentum.
4. The Trade Logic — Let the Market Come to You
Instead of chasing the breakout, the smarter play here could be to wait for the market to revisit demand/support.
Why? Because that’s where new volume tends to enter — where pending buy orders (the UFOs) become filled, strengthening the delta and giving the move fresh fuel.
A potential plan might look like this:
- Entry: 418 (within support)
- Stop-Loss: 411 (below the zone)
- Target 1: 430 (first resistance, partial exit)
- Target 2: 442 (final resistance, full exit)
This setup maintains a clear reward-to-risk ratio above 3:1, assuming disciplined execution and volatility-adjusted sizing. It’s not about prediction — it’s about preparation. Waiting for retracement allows participation in a confirmed move, rather than reacting to emotional excitement at the breakout.
5. Contract Specifications & Margin Requirements
Understanding your instrument is as important as reading your chart.
Here’s what traders should know about these CME-listed Corn contracts:
ZC – Corn Futures (Standard Contract)
- Contract Size: 5,000 bushels
- Tick Size: ¼ cent per bushel (0.0025) → Tick Value = $12.50
- Approx. Margin: Around $1,000 USD, varying by broker and volatility
MZC – Micro Corn Futures
- Contract Size: 500 bushels (1/10th of ZC)
- Tick Size: ½ cent per bushel (0.0050) → Tick Value = $2.50
- Approx. Margin: Around $100 USD, varying by broker and subject to market conditions
Micro contracts allow smaller-scale traders to apply the same analysis and structure as the full-size contract, but with controlled risk exposure — a major advantage for capital management.
6. When New Volume is Injected in the Market
Think of Volume Delta as a glance in the rear-view mirror — it tells us what’s already been filled. On the other hand, analyzing support and resistance levels with the idea of where new unfilled orders might come in helps us prepare to enter trades just before momentum potentially reactivates.
When both are combined:
- Rising delta confirms a healthier follow-through on breakouts.
- Negative delta near resistance warns of a likely fading move.
- Key support and resistance zones show where resting orders could inject new volume.
7. Risk Management — Protect Before You Project
Every solid trade plan starts with a stop.
For this setup, a logical stop below 411 ensures protection if the wedge breakout fails completely.
Scaling out at 430 reduces exposure early, locking gains in case the move stalls.
Always size positions relative to account equity and volatility — the most underrated edge in trading is survival.
The best traders don’t just hunt profits — they hunt consistency. Managing risk transforms a potentially stressful market environment into a structured decision process.
8. CME Context & Final Thoughts
Both ZC and MZC are cornerstone agricultural contracts traded on the CME Group’s CBOT exchange, giving traders exposure to one of the world’s most economically significant commodities.
While the setup we’ve explored is a case study, the takeaway extends beyond Corn:
Breakouts need participation. Volume confirms conviction. Key support and resistance levels reveal intention.
In markets where fake-outs are common, aligning technical structure, order flow, and patient trade planning gives traders the clearest edge of all — confidence grounded in data, not emotion.
When charting futures, the data provided could be delayed. Traders working with the ticker symbols discussed in this idea may prefer to use CME Group real-time data plan on TradingView: tradingview.com/cme/ - This consideration is particularly important for shorter-term traders, whereas it may be less critical for those focused on longer-term trading strategies.
General Disclaimer:
The trade ideas presented herein are solely for illustrative purposes forming a part of a case study intended to demonstrate key principles in risk management within the context of the specific market scenarios discussed. These ideas are not to be interpreted as investment recommendations or financial advice. They do not endorse or promote any specific trading strategies, financial products, or services. The information provided is based on data believed to be reliable; however, its accuracy or completeness cannot be guaranteed. Trading in financial markets involves risks, including the potential loss of principal. Each individual should conduct their own research and consult with professional financial advisors before making any investment decisions. The author or publisher of this content bears no responsibility for any actions taken based on the information provided or for any resultant financial or other losses.
🌟 Take This Analysis Further with Our AI Scripts 🎯 | Discover How at tradewithufos.com 🚀 Choose a Subscription: Monthly ᴼᴿ Yearly ᴼᴿ Lifetime 🗓️ | Unlock Intelligent UFO Scripts Free 💡
Related publications
Disclaimer
The information and publications are not meant to be, and do not constitute, financial, investment, trading, or other types of advice or recommendations supplied or endorsed by TradingView. Read more in the Terms of Use.