Silver’s 2025 Explosion — How High Can It Go?In 2025, Silver ( OANDA:XAGUSD ) has experienced a remarkable surge, making it one of the most notable assets of the year. As we approach the end of 2025, I’ve decided to analyze silver to see how far its bullish trend might continue. So, stay with me as we delve into the reasons behind silver’s rise and explore how far this upward momentum could go.
Let’s begin by looking at the fundamental factors driving silver’s increase in 2025. After that, we’ll move on to the technical analysis.
Fundamental Drivers Behind Silver’s Massive 2025 Rally:
Structural Supply Deficit — Multi‑year deficits draining inventories, tight physical market.
Strong Industrial Demand — Solar, EVs, semiconductors & data centers consuming silver at record levels.
Rate Cut Expectations — Anticipated Fed easing lifts non‑yielding assets like silver.
Safe‑Haven Flows — Geopolitical risk, inflation, and a softer dollar boosting precious metals demand.
Liquidity & Momentum — Smaller market vs gold( OANDA:XAUUSD ) amplifies swings, attracting speculators.
Silver has surged ~ 150–165% YTD , setting fresh all‑time highs as both an industrial metal and investment hedge.
-----------------------
Technical Analysis:
Now, considering the technical side, with less than five days remaining before the six-month and one-year candles close, I’ll focus on a higher time frame for silver’s analysis. Recently, silver achieved a new all-time high, capturing widespread attention, and many prominent figures are now discussing silver’s potential.
From a classic technical analysis perspective on the six-month time frame, it appears that silver has formed a bullish continuation pattern, specifically a cup and handle pattern, and the recent six-month candle has broken the neckline/resistance zone($50-$34) with strong volume. This suggests that the bullish trend for silver is likely to continue.
From an Elliott Wave perspective, it seems that silver is completing wave 3, potentially within an ascending channel and a Potential Reversal Zone(PRZ) .
I expect that silver, upon entering this Potential Reversal Zone(PRZ) , will undergo a correction. If you’re considering adding silver to your portfolio, it’s wise to wait for that correction, as buying at all-time highs can be riskier due to the strong upward momentum.
What do you think? How far can silver’s bullish trend extend, and what levels might we see in 2026?
💡 Please respect each other's opinions and express agreement or disagreement politely.
📌 Silver/ U.S. Dollar Analyze (XAGUSD), 6-month time frame.
🛑 Always set a Stop Loss(SL) for every position you open.
✅ This is just my idea; I’d love to see your thoughts too!
🔥 If you find it helpful, please BOOST this post and share it with your friends.
Cup And Handle

TakeoffAmerican company specialized in the development and use of space launch vehicles, aiming to position itself between Rocket Lab and SpaceX.
The price is preparing for a bullish reversal by breaking the neckline at $24.35, which also completes the Cup & Handle pattern shown in the chart.
First target around $33.30.
Wait for a close above the neckline accompanied by expanding volume.

Inverse Cup and Handle?Looking at the recent BTCUSDT daily structure, there’s a reasonable argument that price may be carving out an inverted cup and handle rather than a simple consolidation. The first rounded top shows a loss of upside momentum after the sharp selloff, with progressively lower highs forming a smooth arc. That’s followed by a smaller, tighter retracement that slopes slightly upward and then rolls over—behavior that fits the “handle” portion of the pattern. Importantly, both structures occur below prior breakdown levels, which keeps the broader context bearish and supports the idea that this is distribution rather than accumulation.
That said, this pattern is still developing, not confirmed. An inverted cup and handle typically wants to see a decisive breakdown below the handle’s low, ideally on expanding volume, to validate continuation to the downside. Until that happens, this could just as easily resolve into a range or a failed pattern if buyers reclaim the handle highs. For now, I’m treating this as a bearish setup with conditional confirmation, watching for acceptance below support rather than front-running the move.

This chart will make the bears cryIt's official: the neck line on the cup and handle of TVC:SILVER on the inflation-adjusted chart has broken to the upside.

BPCL Weekly Chart — Classic Cup & Handle Breakout SetupThis study showcases a textbook Cup and Handle formation — a bullish continuation pattern that reflects long-term accumulation followed by a breakout-ready consolidation.
Pattern Anatomy:
Cup: A rounded base formed over several months, signaling gradual recovery and buyer buildup.
Handle: A shallow pullback in a downward-sloping channel, indicating controlled profit booking before breakout.
Neckline: Resistance zone connecting the highs before and after the cup, now acting as breakout trigger.
Targets:
🎯 Target 1: Based on neckline breakout projection
🎯 Target 2: Extended move aligned with weekly momentum
🧠 Strategic Insight
This setup reflects institutional accumulation, with breakout confirmation supported by volume expansion and volatility uptick. Traders can use pullbacks to the neckline as re-entry zones, with stop-loss below the handle base.

Silver on its way to 89.51 $SI_FWith the depth of the rounded bottom looking for a pause on the #silver futures $SI_F at $89.51 then up to $100 or higher.

PSO - 1H Cup & Handle FormationPSO – 1H Update 📊
After completing the cup, the handle formation is in progress.
Price is currently at a multi-time support/resistance zone (450–455), which can act as the potential low of the handle. A bounce is expected from this area.
On RSI, bullish divergence is developing and RSI is near oversold levels.
If the divergence plays out, it can confirm a trend reversal.
Fresh buyers may consider entries from this zone, while previous buyers can continue to hold.
Targets (Insha Allah):
🎯 500+ | 510 | 530

PSO - Short Term Round bottom formationPSO is developing a well-defined rounded bottom on the 1H chart, with price now approaching the major neckline at 480. A decisive breakout above this zone would confirm the reversal pattern and open the door for continuation toward higher resistance levels. Bullish structure remains intact while holding above 450–455

SCHW's Weekly Pour: A Cup, a Handle, and a Bullish Refill?Been tracking SCHW, and this chart is shaping up to be something big—potentially a breakout from a range that’s been developing since early 2022. Price is pressing up against key resistance around $95-$100, and a clean break above this level could confirm a multi-year breakout, opening up the possibility of a much larger trend move. With Fibonacci extensions lining up at $150 and $200, this could be one of those slow-burn setups that eventually pays off in a big way. Let’s break it down.
Fibonacci Extensions and Multi-Year Price Targets
The way this chart is structured, $95-$100 is the final boss. If price convincingly clears that level, it breaks a massive range that’s been in place for over two years. If that happens, $150 (the 161.8% Fib extension) and $200 (the 261.8% extension) are the next major upside targets. These aren’t short-term price points—this is the kind of move that could play out over multiple years. But historically, when a stock coils for this long and then breaks out, the measured move potential is huge.
Moving Averages and Long-Term Trend Shift
Right now, we’ve got price trading above both the 50-week and 200-week moving averages, signaling that momentum has already started to shift. The 50-week MA is curling upwards, and if we see it hold above the 200-week, that would mark a long-term trend shift that typically aligns with sustained upside moves.
Mapping Out the Breakout Scenarios
If we do get a breakout, here’s how I see it playing out:
1️⃣ Break Above $100 → Multi-Year Uptrend Begins – A confirmed break and hold above $100 shifts the entire structure bullish, setting up an eventual run to $150 and possibly $200 over the next couple of years. This would be the full resolution of the pattern that has been developing since early 2022.
2️⃣ Rejection at $95-$100 → Pullback Before Breakout – If price gets stuffed at resistance, we could see a pullback to the $75-$80 zone before another breakout attempt later in 2025. This would act as a final shakeout before the bigger move.
----------------------------------------------------------
All eyes on $95-$100. That’s the level that determines whether this just grinds sideways for another year or finally starts a major new uptrend. If it breaks, we’ve got a clear roadmap to $150 and $200 in the coming years.
Curious if anyone else is watching this. Are we about to see the start of something big, or is there one more fakeout before the real move?
Not financial advice. Just charting things out. Let’s see what happens.

Is Tesla Ready for a Major Breakout? Key Levels Explained
Market Structure
• Medium-term trend remains bullish
• Price is holding above the 50-day SMA (~$440) → trend is still valid
• TSLA is testing a major horizontal + dynamic resistance zone (480–490)
Key Pattern
• A clear Cup & Handle formation
• The rim of the cup aligns with current resistance
Bullish Scenario (Primary)
If TSLA:
• Breaks and holds above $490
• Confirms breakout with volume
Targets:
• 🎯 Target 1: $520–540
• 🎯 Target 2: $580–600
• Confirms continuation of the larger uptrend
Bearish / Pullback Scenario
If:
• Price gets rejected from the resistance zone
Key Supports:
• First support: $440–445 (50 SMA)
• Major support: $400–410
• Breakdown below → deeper correction toward ~$360 possible
Conclusion
• TSLA is at a critical decision level
• Breakout favors bulls
• Rejection leads to a healthy pullback within an uptrend

Monthly Swing IdeaWe’re seeing a rounding bottom forming with a major bullish imbalance. Weekly structure confirms a bullish trend, and recent weekend gaps are stacking in favor of buyers.
This setup suggests strong upside potential. Investing an amount you’re willing to risk could yield gains if momentum continues. Always manage risk—stops below the recent swing lows are recommended.
Bias: Bullish ✅

This is why $SILVER Bears are WRONGThe TVC:SILVER bears have been arguing that the recent parabolic move in TVC:SILVER will end the same way it did in 2011. However, market conditions were different in 2011 than they are now. In 2011 the long end of the rate curve TVC:US10Y was DECLINING (see bottom chart). The situation now is not the same: Interest rates have broken out from that downtrend and formed bullish technical patterns. Rising interest rates will only add fuel to the fire and push TVC:SILVER much higher. I can already hear the noobs saying: "But the FED is cutting rates." The FED only controls the short end of the curve. Moreover, the FED has initiated a new round of QE, and TVC:SILVER is probably sniffing out the inflation that is on the horizon.
DO YOUR OWN RESEARCH; THIS IS NOT FINANCIAL ADVICE.

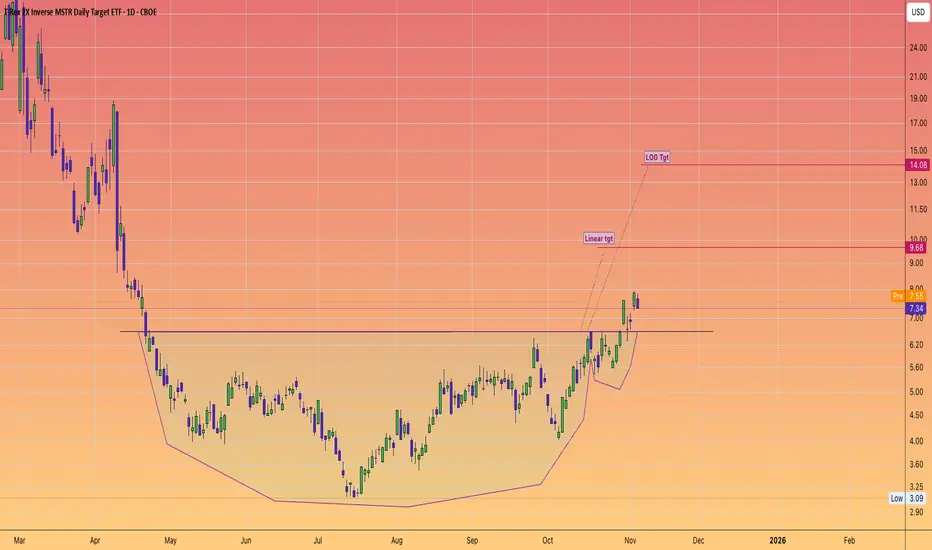
Trade idea: $MSTZ 2X inverse #MSTRThese measured moves are determined from the #cupandhandle pattern.
There is also a inverse head and shoulders pattern within the CUP section, giving further credence that we shall this pattern perform to target.
And thus see further weakness with #Saylor's #Bitcoin investment vehicle.
What goes up must come down.
The current BTC nav sits at $65,827
The premium is leaking out with the mNav at 1.34 likely to test parity
A reminder to all the $SILVER bearsTVC:SILVER is NOT in a "bubble." It is simply finding its true value in relation to other asset classes. Silver has not even broken inflation-adjusted ATH (top chart). Silver bulls have been expecting this parabolic move for decades due to massive price suppression and deficits. The cup and handle pattern was simply the technical pattern that indicated this recent move. From the inflation adjusted view, the cup is only now about to break out, then the bears will really have something to cry about. Moreover, TVC:GOLD has been ripping for several quarters, therefore TVC:SILVER is ripping in response: see the GOLD/SILVER ratio which is presently adjusting to historical norms (middle chart). Finally, TVC:SILVER is finding true value in relation to the over-valued SP:SPX (bottom chart). Once TVC:SILVER breaks inflation adjusted ATH and becomes expensive in relation to TVC:GOLD and SP:SPX , then the Bears can lecture the Bulls about "bubbles."
DO YOUR OWN RESEARCH; THIS IS NOT INVESTMENT ADVICE.

Pour me a cup of SOLANA plzOn the weekly chart, I see a really nice cup and handle pattern.
This pattern is historically a bullish sign of good things to come.

ONTO: cup and handle breakoutONTO broken out of a cup and handle neckline
Now retesting the breakout area
Best to buy near 150
Targets would be 175-200
SL 140 on closing basis

PSO – Cup & Handle Breakout Setup (4H Chart)Pakistan State Oil (PSO) is completing a strong cup and handle formation on the 4H timeframe, supported by an improving price structure and rising volume activity near the neckline zone. Price has respected higher lows throughout the handle, indicating strength and reduced selling pressure.
A confirmed breakout above 495.22, accompanied by strong volume, can trigger a continuation rally toward upper resistance levels.
Trade Plan
Entry Strategy
25% Entry: 470.93
25% Entry: 484.27
50% Entry: 495.22
Stop Loss : 453.26
Targets
TP1: 515.28
TP2: 546.29

Cup & Handle on SYSTEMS LIMITEDSYS is forming a solid Cup & Handle structure.
Plan:
25% entry below the neckline (handle zone)
25% at neckline
50% on breakout with strong volume
Entry: 171.70
SL: 158.16
TP1: 185.24
TP2: 198.78
Pattern remains bullish above SL.
Fundamental Boost : Systems Limited plans to acquire Confiz, signaling expansion and future growth potential.
Earnings Strength : The company reported a 46% jump in 9MFY25 profit, supporting a continued bullish outlook.
Key Fundamental Highlights (Systems Ltd)
EPS Growth (YoY) : +42.3% — very strong earnings expansion momentum.
Net Profit Margin : 13.02% — solid profitability for a tech services firm.
ROE : 24.28% — excellent return generation, shows strong management efficiency.
ROA : 17.2% — highly productive use of assets.
Current Ratio : 3.09 — strong liquidity, low balance-sheet stress.
Debt to Equity : 4.6% — almost debt-free structure, financially stable.
P/E Ratio : 24.56 — fair for a high-growth tech company; not overpriced.
Price to Sales : 3.21 — valuation still growth-based but reasonable.
Enterprise Value to EBITDA : 19.57 — growth stock valuation premium, but within acceptable range.
Equity YoY Growth : +25.43% — strong capital expansion phase.
Net Sales YoY Growth : +18.9% — revenue pipeline expanding.
Book Value/Share : PKR 31.11 vs Price PKR 167 — valuation premium, typical for tech leaders.
Disclaimer:
This idea is for educational and research purposes only, based on technical patterns. It is not investment advice. Always conduct your own analysis (DYOR) and manage your risk carefully before entering any trade.

25076 is a super level. Watch for further drops if it breaksSee all the arrows where this level got respected. Some sessions it was the perfect bounce on CME_MINI:NQ1! CME_MINI:MNQ1! and other sessions, it was the level that caused an instant flush down or rocket up. I suspect price to hover around this level and either accumulate before a complete reversal or trap some bulls before a drop down to mid 24000s. I'd set the next max bounce level around 24649 if we give up this level.
Set your TradingView alerts and see what happens around this level. You can put alerts on your horizontal line if you really want to. See image below.
One last thing: if you see the 4 hour chart a little more zoomed in you'll notice an inverse cup and handle:
This should give another 200 point flush at the very minimum. If you are really eager to catch a bounce, watch this demand zone at 24816.

Did you lose faith in the Bitcoin Miners??? WAGMI #WGMIThe Bitcoin miners ETF WGMI
has a lovely setup
you could be picking up cheap miners
slurping that blood!
For summertime profits... If you have the b@lls (& capital of course)
#CupandHandle
Clear as day
for all to see --- Yet sentiment is in the toilet.
Marvelous!
#CLSK
#WULF
#BITF #BITF.TO
#HIVE #HIVE.V
#MARA
#MIGI
#RIOT
#HUT
#GREE
#ARBK
#BTBT
#BTDR
#BTCM
#CORZ
#NILE
#IREN
#DMGI
#CIFR

$DOCN — Classic Cup & Handle taking shape📈 NYSE:DOCN — Classic Cup & Handle taking shape
DigitalOcean is setting up a clean continuation pattern after a strong prior advance. Despite software pressure, this one continues to outperform with RS ~93 — institutions are clearly defending it.
🔍 What stands out:
• Well-formed cup with orderly depth
• Tightening handle near highs
• Price holding above key MAs
• Relative strength refusing to break
Short-term, we may see a little handle digestion after today’s pullback — that’s normal and constructive. What matters is the structure.
If this tightens and volume confirms, it’s a textbook breakout candidate.
Chart below 👇
#stocks #trading #technicals #cupandhandle #DOCN #software #MarketPrep

ZOOMing back to $160 $ZMZoom is already a solidly profitable, mid teens P/E on forward earnings and very strong gross margins versus large SaaS and tech peers.
Recent quarters have shown revenue growth reaccelerating from a low base.
Management has repositioned the company as a unified communications and AI centric platform
(ZOOM workplace, Phone, contact center, AI companion) broadening it's TAM beyond meetings and supporting upsell to existing enterprise customers.
Zoom has a strong balance sheet and robust free cash flow, which limits downside and offers buyback optionality.
#CupandHandle

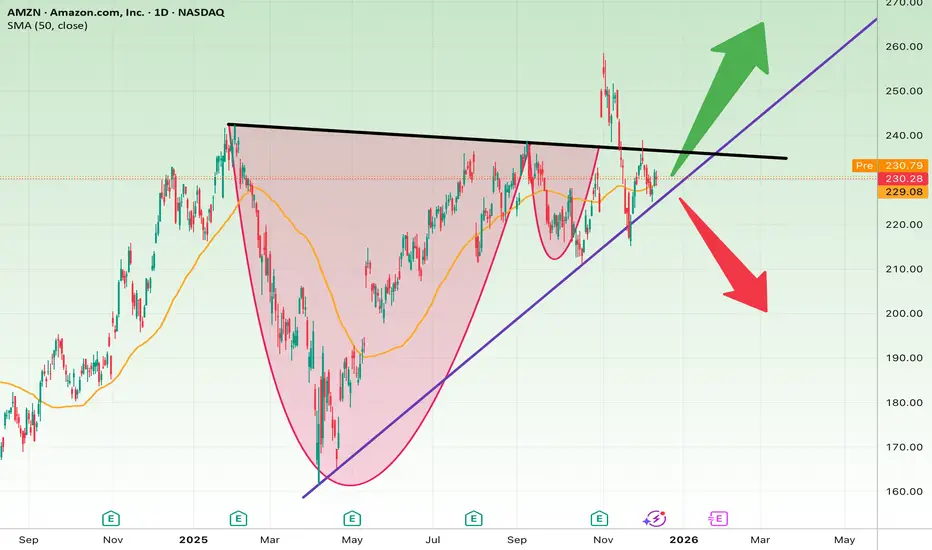
Amazon at a Major Decision Point (Breakout or Breakdown?)The chart shows a very important setup:
• A completed Cup & Handle pattern
• A strong ascending trendline still intact
• A long-term descending resistance line
Price is compressing between the trendline and resistance → major decision point.
Bullish Scenario
If AMZN closes above $235:
• Target 1: $245
• Target 2: $255
• Target 3: $268
• Stop-loss: Below $226
Bearish Scenario
A breakdown below $224 triggers:
• Target 1: $215
• Target 2: $205
• Target 3: $195
• Stop-loss: Above $230
Short Fundamental View
• AWS remains Amazon’s growth engine
• Retail recovery in the U.S. supports revenue
• Most analysts maintain Buy ratings
• Risks: rate pressure, AI competition, logistics costs