AUDUSD: A Rare “Stop & Reverse” Trading OpportunityToday, we’re taking a look at the AUDUSD, and this is one of those charts that really makes technical traders smile—because we’ve got two patterns forming at the same time that actually complement each other, rather than conflict.
On one hand, we have a potential head and shoulders top, which points toward a bearish trading opportunity if price confirms the pattern. On the other hand, we also have a potential bullish Cypher pattern, which would offer a buying opportunity if it completes as expected.
At first glance, this might sound confusing. How can a market present both a bullish and bearish setup at the same time?
Why This Setup Is So Unique
The key detail here is location. The completion point of the Cypher pattern lines up almost perfectly with the level where I’d be looking to take profits on the head and shoulders trade. In other words: If the head and shoulders plays out, that downside target becomes the exact area where the bullish Cypher would be completing. This creates a rare and powerful situation where a trader can potentially use a “Stop & Reverse” approach: Trade the head and shoulders to the downside, take profits at the Cypher completion zone, then, flip the position and trade the move back to the upside
Rather than choosing between bullish or bearish bias, the market gives us a structured plan for both scenarios, all based on price action and pattern completion.
The Big Takeaway
This is a great example of why technical analysis isn’t about predicting the market—it’s about preparing for multiple outcomes. When patterns align like this instead of asking “Which direction will price go?”, we can focus on “What will I do when price gets here?”
If you have any questions, comments, or want to share your own opinion on the AUDUSD, feel free to leave them below.
And as always, I’d really appreciate it if you hit that like button before you go.
Akil
Cypher

BTC — Cypher Pattern, Fading Momentum & What Comes NextAfter the –36% drop from ATH, Bitcoin has found support in the 80K–90K range, where price has now been chopping sideways for almost 60 days. This kind of consolidation is pretty typical after a sharp selloff.
Back in June 2025, I already mentioned that a potential Cypher harmonic could be forming on BTC. At the time it was still early, but months later the structure is lining up very cleanly and looks like it’s playing out step by step.
The 86K–82K zone remains a key support area that bulls need to defend. Losing this zone would be a big deal technically and would likely open the door for further downside.
Macro Context
Cypher patterns are powerful because they combine:
impulse exhaustion
failed continuation
deep retracement psychology
They tend to appear near major cycle inflection points, especially after extended bullish phases and distribution-style highs. This makes them particularly relevant in the current market environment.
Let’s break the structure down step by step.
Cypher Structure Breakdown (X–A–B–C–D)
BTC has respected the key Fibonacci relationships of a Cypher extremely well.
X → A: Impulse Move
This was a strong, clean impulsive leg showing clear bullish dominance and participation.
Psychology:
Late bears trapped, early longs confident
A → B: Pullback
Price retraced to 0.579, sitting nicely within the Cypher sweet spot (0.382–0.618).
Structure held, which is crucial.
Psychology:
Doubt kicks in → “Is the move over?” → weak hands get shaken out.
B → C: Expansion & Euphoria
BTC pushed to the 1.274 extension of XA, clearly exceeding point A.
This is where optimism peaked and momentum chasing kicked in.
Psychology:
FOMO → breakout buying → late-cycle confidence
C → D: Reversal Zone
This is the most important part of the structure.
0.786 retracement of XC
Completion zone around 65.5K
Strong overlap with:
2021 ATH
2024 trading range
Psychology:
Euphoria → disbelief → forced selling → acceptance.
Where We Are Now
Bitcoin is currently trading between C and D, meaning:
we’re in a corrective phase
volatility has faded
and for the first time in four years, we’re seeing a clear bearish bias after a long period of bullish momentum
100K psychological level remains the major overhead barrier. As long as price stays below this level, bulls are on the defensive.
Macro Check
The broader technical picture remains cautious:
Below previous yearly open (93.5K)
Above yearly open (87.6K)
Below weekly 21 EMA/SMA (98K-102K)
Above monthly 21 EMA/SMA (87K–89K)
Structurally, this looks very similar to previous cycle transitions where momentum slowly faded before deeper moves followed.
Scenarios Going Forward
🔴 Primary Scenario
If the Cypher continues to play out:
downside pressure persists
volatility expands near liquidity pockets
target zone sits around:
66K–64K, centered near the 0.786 Fib (~65.5K)
This would be a healthy macro correction.
🟢 Invalidation Scenario
The bearish structure weakens if:
BTC reclaims and holds above prior value
price shows acceptance above 100K
momentum flips bullish again
In that case, the Cypher either gets delayed or invalidated.
Final Thoughts
Right now, the data favors patience and caution.
The most ideal path would be:
a push into the 97K–100K resistance zone
followed by continuation lower toward the 74.5K year low, which I’d like to see taken out
In choppy conditions like this, no trade is still a trade. Staying flat, preserving capital, and waiting for clarity is often the smartest move. Plan your levels, set alerts, and only act when the market gives you a high-probability setup.
_________________________________
💬 If you found this helpful, drop a like and comment!

CIFR Macro analysis | The bigger picture | Long-term holdersNASDAQ:CIFR
🎯 CIFR remains in a wave (4) of 3 range, near the all-time high. Wave 4s are expected to be drawn out, often being a triangle or flat correction, where most traders give their money back to the market due to whipsaw and fakeouts.
📈 Weekly RSI has printed bullish divergence above the EQ, but with no strong reaction yet. This can take months to play out sometimes. Falling below the orange trend line will negate this divergence.
👉 Analysis is invalidated if price falls below the 0.5 Fibonacci retracement at $6.35
Safe trading

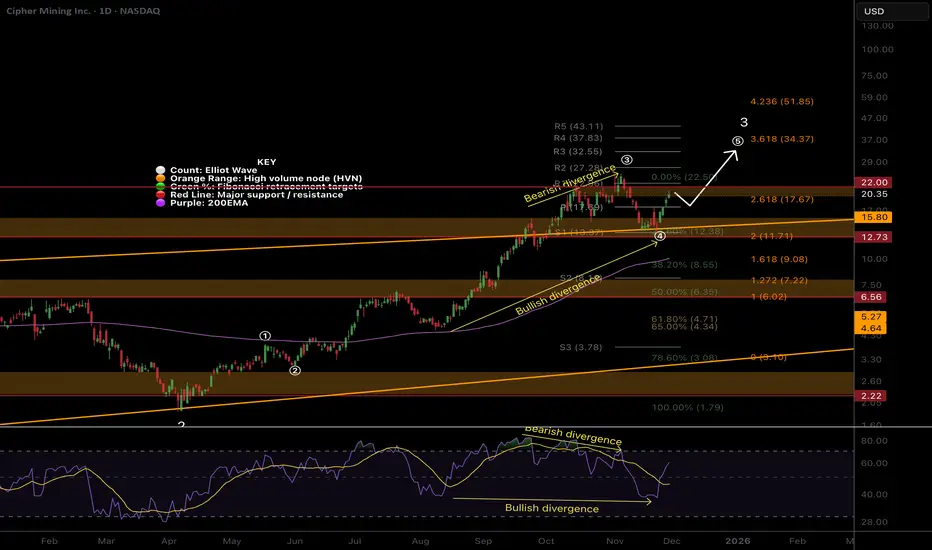
CIFR Short-term analysis | Trading and expectationsNASDAQ:CIFR
🎯 Wave d of the triangle may still be underway, wave e is expected to end at the daily pivot where price currently sits, above the daily 200EMA, showing the uptrend is still intact but flattening.
📈 Daily RSI bullish divergence has failed to play out, showing the bears are in control.
👉 Analysis is invalidated if price falls below wave C, $12.50, suggesting a deeper retracement
Safe trading

Newmont Corporation (NEM) – Short Setup Technical AnalysisNewmont Corporation (NEM) – Short Setup Technical Analysis
NEM is currently trading well above the 3rd Anchored VWAP band, reflecting a significant price–value dislocation and elevated mean-reversion risk. At this level of deviation, upside continuation typically becomes inefficient and increasingly dependent on late participation.
This overextension coincides with the formation of a bearish Cypher harmonic pattern, which often develops near exhaustion points within extended moves. The Cypher completion zone defines a technically sensitive area where bullish momentum frequently deteriorates and distribution risk increases.
From a tactical perspective, this setup favors a mean-reversion short rather than trend continuation. A rejection from the current level or loss of acceptance above the upper VWAP band would confirm bearish control and increase the probability of a rotation back toward the Anchored VWAP and prior value area.
Bias: Short on rejection above the 3rd VWAP band
Target: Mean reversion toward Anchored VWAP
Invalidation: Sustained acceptance above the Cypher completion zone
Context: Bearish Cypher completion + extreme VWAP deviation = asymmetric short opportunity

Cypher setup on the hourly chart… back to 13110?Looks like a Nice cypher setup . Just need to keep her below the 13375.

Pound Setup is still hanging around…The pound is still hanging around at the top of a possible triple zig zag that could target 127-128. While overall I believe the pound is going to move higher , this would give a low risk setup for a long position. I’d like to see all closes below 1.3375. Let’s see if this scenario plays out.

BTC Bullish CypherCorrect from $94-97k area
Bottom ideally around $83k for higher low
Possible mid-70ks if extended 1.618 retracement
Long into $100k+

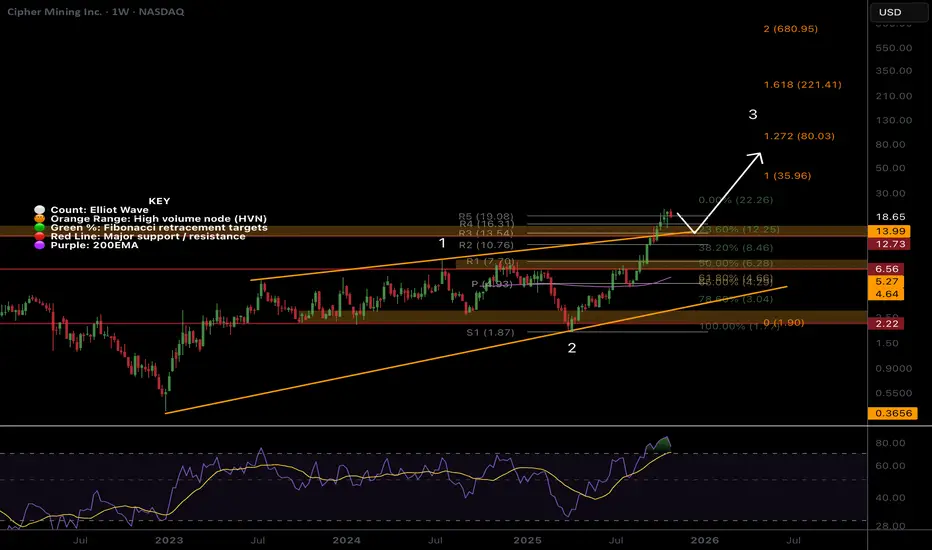
CIFR Ready for higher?NASDAQ:CIFR We got the pullback I was looking for from the last report. Locally, price appears to have completed wave (4) of 3 and looks ready for continued upside.
Wave (4) tested the previous trend-line, S1 pivot, 0.236 Fib and High Volume Node as support- a strong support area.
📈 Daily RSI has printed a confirmed bullish divergence from oversold.
👉 Continued downside has a target of the 200EMA at $11

HISTORICAL HARMONIC EGJust happened to look back and see how harmonic EURGBP has been during recent times. Will it contine?

USD/CHF – Bullish Cypher Pattern + RSI Divergence ConfirmationUSD/CHF – Bullish Cypher Pattern + RSI Divergence Confirmation
On the lower timeframes (M15), price has completed a Bullish Cypher Pattern into the PRZ (Potential Reversal Zone) with confluence:
XA retracement: B leg at 0.786
AB extension: C leg 1.272
PRZ completion: D at 0.786 of XC
Additional confirmation:
Bullish Divergence on RSI suggesting potential reversal momentum.
Market reacting off prior structure support.
Targets:
TP1 → 38.2% retracement of CD
TP2 → 61.8% retracement of CD
TP3 → 78.6% retracement of CD
This setup aligns with my structured approach: pattern recognition + confirmation + Fibonacci-based targets.
⚡ Lesson: Patterns provide opportunity, but confirmation and disciplined management determine success.

CIFR Pullback time?NASDAQ:CIFR Locally, price continues into price discovery with big jumps suggesting wave 3 is still going Wave (5) of 3 appears to be underway which could end at any moment. I am still expecting a retracement to test the previous all time high and punish late investors who are chasing prices up, trapping them into capitulation later.
Wave 4 has a downside target of the 0.236 Fibonacci retracement, High Volume Node support + the trend-line retest, $14. This may also meet the ascending daily 200EMA.
Daily RSI has a series of bearish divergence from overbought which a strong signal for a reversal.
Continued upside could run the daily pivots to $38.

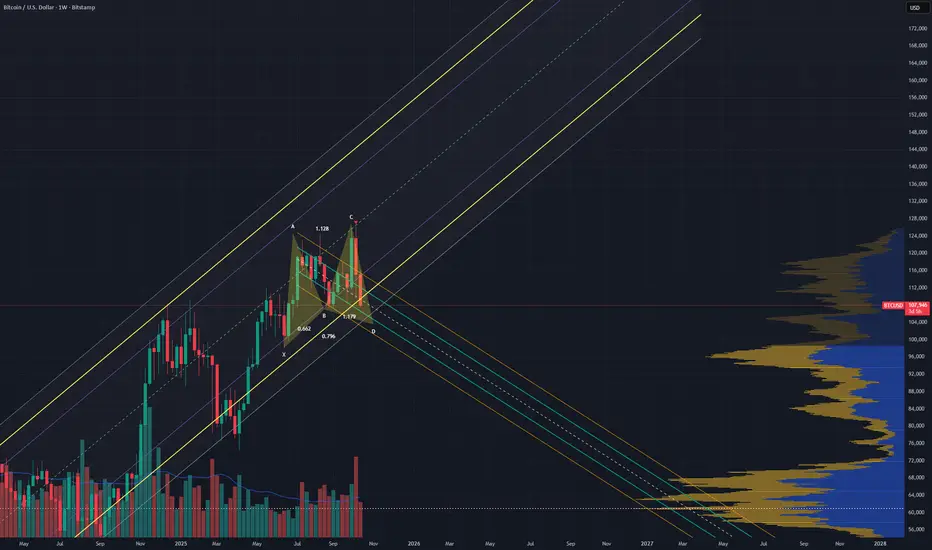
BTCUSDT (Weekly) – Cypher Harmonic Pattern Targeting Key Demand Bitcoin is currently forming a Cypher Harmonic Pattern on the weekly timeframe — a rare but reliable reversal setup that often appears near exhaustion phases of a macro move.
This structure aligns with potential mid-cycle correction before continuation, providing a clear roadmap for both bulls and bears.
Cypher Harmonic Structure
The Cypher pattern follows strict Fibonacci ratios:
XA leg: The initial impulsive wave defining trend direction.
AB retracement: Retraces between 0.382–0.618 of XA (here ~0.58).
BC extension: Expands to 1.13–1.414 of AB (here ~1.27).
CD completion: Extends to 0.786 retracement of the XC leg — this defines the potential reversal zone (PRZ).
In this setup:
X → A → B → C structure is complete.
Price is now heading toward point D, projected between $50,000–$65,000, the ideal PRZ for this Cypher.
The highlighted green box marks this completion and potential accumulation zone.
Technical Confluence
Weekly RSI Divergence
Bearish divergence appeared between point B and C — confirming a loss of upward momentum.
RSI now approaching mid-levels (40–45), aligning with a healthy reset within a broader bull structure.
Volume and Momentum Shift
Declining bullish volume since the C-leg high, typical before harmonic completion.
Short-term bearish bias persists until D-zone validation.
Fibonacci and Structure Alignment
The 0.786 retracement of XC overlaps with historical weekly demand.
This overlap reinforces the D-zone as a strong potential reversal point.
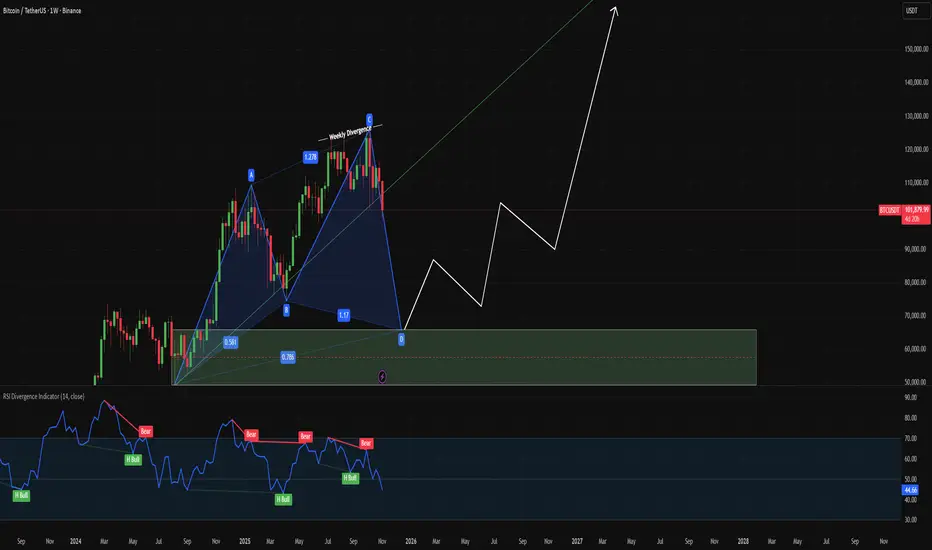
Scenario Planning
Base Case (Cypher Completion):
BTC retraces toward $55K–$60K (D-leg).
Price stabilizes within PRZ and confirms structure with bullish divergence on RSI.
Potential upside reaction back toward $90K+ over the next few quarters.
Alternative Case (Invalidation):
A weekly close below $50K would invalidate the Cypher completion and shift bias to extended correction territory.
Trading Considerations
Aggressive Entry: Scale into longs within the PRZ ($55K–$60K) once momentum indicators show exhaustion.
Conservative Entry: Wait for bullish confirmation on higher timeframes (weekly close above prior swing low).
Invalidation: Close below $50K zone.
Risk management is crucial — the Cypher is high-probability but not infallible.
Conclusion
The Cypher Harmonic Pattern suggests BTC may be in the latter stages of a mid-cycle correction.
If historical structure repeats, the D-point could serve as the macro reaccumulation zone before the next impulsive leg of the bull cycle.
Bias: Short-Term Bearish → Mid-Term Bullish
Pattern Type: Cypher Harmonic
Key Zone: $50K – $65K
Invalidation: Weekly Close < $50K
Solana going to rise very fast over the next few days, 235-245Divergences and strength of the come back in now in the 6hr charts are going to lead to a surge in prices again as we possibly even go to a new high from here with Solana and BTC possibly

CIFR shallow pullback still on the cards!Price is in a macro wave 3, the strongest and most powerful move described as a “wonder to behold” by Ellioticians. When price is in a wave 3, pullbacks are shallow and few. Investors get overconfident and excited adding positioning without correct risk, swept up in the big move, aggravated by influencers and the media.
Testing the previous all time high at the 0.236 Fibonacci retracement and upper trend-line will be a strong support area and a place to look for a long, $14. While breaking out again into all time high could see price continuing its strong uptrend, this is doubtful as we have run the weekly pivots. Further downside has a target of the previous all time high and R1 pivot at $8.
📈 Weekly RSI is oversold with no divergence and can remain here for months as price keeps increasing.
👉 Analysis is invalidated below the weekly pivot and 200EMA ~$5
$BTCUSD Bullish CypherBITSTAMP:BTCUSD Bullish Cypher pattern: although prices can go down to test the spike low around $104K, there is a very good chance that the previous spike low of $104K has completed the pattern. This would mean that we are already in a uptrend and is currently doing a pullback on a lower timeframe. I believe $106K area is a strong support band.

AUDUSD eyes bearish Cypher patternOn the daily chart, AUDUSD stabilized and rebounded, with short-term bulls in the ascendant. Currently, attention can be paid to the resistance around 0.6650, which is a short position for a bearish cypher pattern and is also within the previous supply zone.

DXYDaily structure pointing to an easing of price action in the near term. 5 bar fractals providing the extremes of the range. The bullish Cypher is obviously incomplete and a guess. But the bottom of the range and the shift in sentiment needs to be revisited before any upside. The Cypher would give us the wyckoff spring and upside taking out highs on the way to 💯.

Gbpusd Cypher patternUsing Market structure from the daily and a bearish harmonic from the 4 hour. A nice risk reward trade has showed itself. Stop loss is above the D anchor and tp is below the major low. Line drawing is used to keep chart clean.

USDCHF upside target 0.8000On the 4-hour chart, USDCHF has formed a bullish cypher pattern, suggesting a short-term upward trend. Buying opportunities around 0.7920 are currently on the horizon, with an upward target around 0.8000.

EURJPY: Two Potential Advanced Patterns Setting UpWe’ve got a pretty interesting situation developing on the EURJPY, where not just one, but two potential advanced pattern formations setting up simultaneously. Opportunities like this don’t happen often, and they’re a great example of how structure and symmetry can align to give traders multiple reasons to get involved in the market.
Identifying the Dual Pattern Setup
What makes this chart particularly exciting is that the two patterns overlap within the same price zone, creating a powerful confluence area. When multiple patterns or Fibonacci-based setups complete around the same levels, it increases the probability of that zone acting as a significant turning point.
In the video, I’ll walk you through how to measure out each pattern step-by-step, showing you exactly where the completion points line up.
The Takeaway
Whether you’re an advanced pattern trader or simply looking to refine your technical analysis skills, this EURJPY setup is a great example of how disciplined pattern recognition can reveal high-probability opportunities.
I wish you guys a great week of trading!
Akil

These channels and harmonic are all you need to know for BitcoinThe channel BTC goes to and stays in once this harmonic completes will tell you where CRYPTOCAP:BTC will go