INTC – What Price and Volume Are Telling Us ?INTC - CURRENT PRICE : 37.40 - 37.60
INTC is currently undergoing a controlled pullback within a broader rising structure, as indicated by the rising trendline support (white dashed line). Notably, the recent price decline is accompanied by diminishing volume, which suggests that selling pressure is losing momentum rather than aggressive distribution.
This type of price-down / volume-down behavior typically reflects profit-taking and short-term exhaustion by sellers, often seen during healthy corrections within an uptrend. As long as price continues to respect the rising trendline, the broader bullish structure remains intact.
From a volume perspective, there is no evidence of panic selling, while prior upswings were supported by higher relative volume — reinforcing the view that buyers remain in control at higher timeframes.
Take note that stochastic oscillator is approaching near oversold zone. In an uptrend, any oversold condition may be considered as a potential buy on dips.
Trading Plan (Price & Volume Based)
Buy on pullback near the rising trendline support
ENTRY PRICE : 36.00 - 37.00 zone
Upside Targets:
🎯 Target 1: 40.00 (near-term resistance)
🎯 Target 2: 44.00 (prior swing high)
🧊 Cut Loss: Below 33.00, which would signal a breakdown of trend support.
Stochastic Oscillator

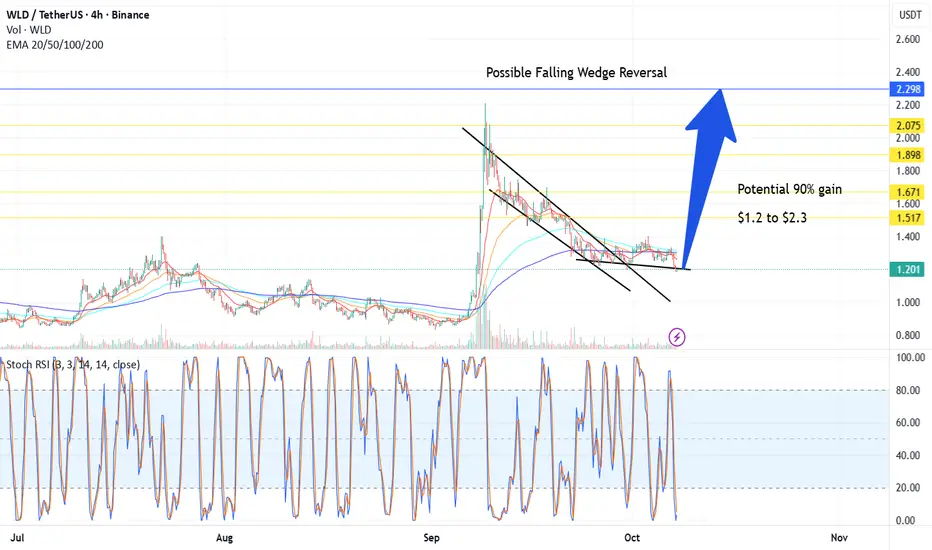
Possible Falling Wedge Reversal +90% run – 4H Setup - Worldcoin BINANCE:WLDUSDT could gain 90%
⚙️ Setup
Price has been trending down within a well-defined falling wedge since the local high.
Currently, it’s testing the lower trendline with Stochastics oversold and curving up, suggesting waning bearish momentum.
Volume has compressed, which is typical before a breakout.
We’re now at a decision point: either a bounce and breakout or a confirmed wedge failure.
Stochastics: Oversold (<20) with a possible bullish cross forming.
Volume: Decreasing — consistent with the final stages of compression.
EMAs: Price hovering around/under short EMAs (20–50); a close above them could trigger momentum shift.
📈 Plan / Hypothesis
Watching for bullish breakout confirmation above the upper trendline with increased volume.
Target: Height of the wedge projected upward (~ from breakout point).
Invalidation: 4H candle close below the lower trendline with volume expansion.
💭 Fundamenteal Thought:
We may or may not like Altman or Worldcoin's course of action to learn how to validate humanness, but the thing is, it's the only exposure we have to OpenAI and ChatGPT, and with AI everywhere, we are gonna need more than ever to validate people being real.
Considering Open AI, the disease, being worth $500 Billion, I think that the potential cure that Altman himself fabricated, Worldcoin, having a market cap of less than $3 Billion is pretty cheap. There's still many token to airdrop.
Anyhow, it all depends on what utility the token ends up delivering, I see that if this token is used to validate humanness, this will be really valuable. And ofc of what competitors do.
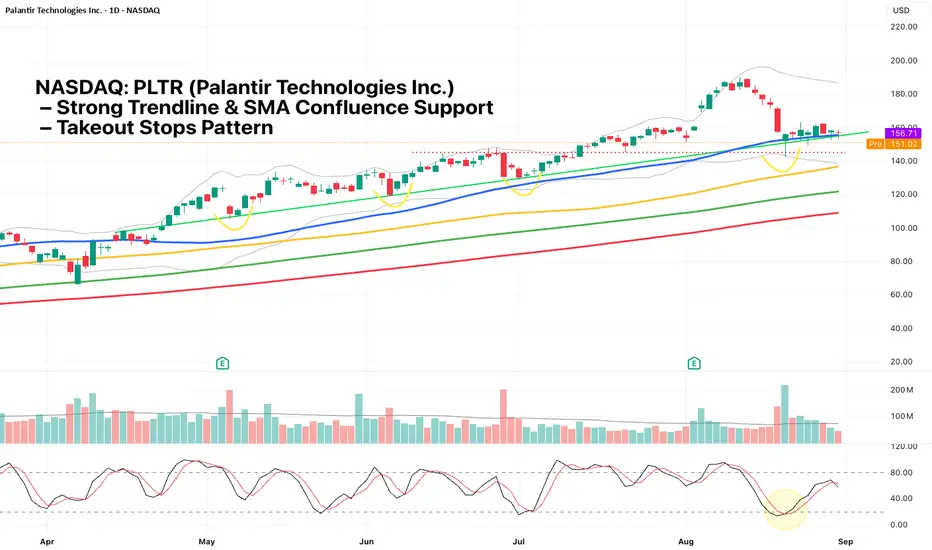
NASDAQ: PLTR – Strong Trendline & SMA Confluence SupportNASDAQ: PLTR Palantir remains in a clear uptrend with the moving averages aligned (SMA 50 > SMA 100 > SMA 150 > SMA 200). Since April, price has consistently traded above the 50-day SMA, finding support on each pullback to the trendline (green line). This trendline has been tested four times over the past six months, the latest on August 20.
On August 20, PLTR formed a hammer candlestick while testing multiple key supports simultaneously:
1) Horizontal support (red dotted line)
2) Cut Lower Bollinger Band
3) Tested 50-day SMA
4) Trendline support (green line)
5) Stochastic in oversold zone
6) Takeout stops pattern: wick flushed below prior lows, likely taking out stops before reversing
This strong confluence of signals suggests buyers are defending the level, offering a favorable risk-reward setup.
News mentions of Nuclear this & Uranium that, whats the Macro?This is a look into the macro developments happening currently in UROY.
This is strictly a TA look into the big picture. We zoom out to Timeframes bigger than 1W.
At times zooming in to check (3 Day, 5 Day, maybe 1D) for potential swing trades.
I tend to look into things like price action, indicators, volume and other data to sway probabilities of where an asset may go and determine best opportunities of supply and demand zones based on my interpretations.
So jumping right in this is a look into price action on the 1 Month timeframe.
Looks to me like a massive macro falling wedge.
But theres massive volume. So thats a little contradicting.
In anycase always look for confirmation of breakouts.
On another negative note: this is only 5 years of data. Would have loved more price data.
Also note potential bullish cross of STOCH RSI, a momentum indicator. Still need confirmation though. If blue and orange line above 20 level on STOCH at monthly candle close.
COuld be a positive.
But key is to watch for confluence of many signs and or indicators.
I will be keeping my eyes on this.
Look for more posts as things develop on UROY.
DISCLAIMER: This is not financial advice, i am not a financial advisor. The thoughts expressed in the posts are my opinion and for educational purposes. Do not use my ideas for the basis of your trading strategy, make sure to work out your own strategy and when trading always spend majority of your time on risk management strategy.

Is Altseason Around the Corner? BTC.D looks tired AF!BTC dominance just hit the top of a rising wedge that has been building for over a year. Price is stalling at 65.64 percent, sitting right against long-standing resistance.
Momentum is weakening. Stochastic RSI is at 72 and starting to roll over. RSI is sitting just under 70 and showing early signs of fading.
The structure suggests we are close to a decision. If BTC dominance starts to fall from here, the conditions for an altcoin run are in place.
Key levels to the downside are already mapped. First is 59.97 percent. Then 58.70 percent. After that, 56.88 percent. The 100-week simple moving average is also sitting at 56.51 percent. If dominance breaks below that level, it opens the door for a larger shift in market flow.
Previous retracements in BTC dominance have aligned with strong moves in altcoins. This current setup is technically clean and nearing resolution.
It is not confirmed yet, but the signals are starting to stack. This is a moment worth watching.

DXY, bullish or bearish?Welcome back!
Today i'm posting a small idea on the DXY. Usually i cover crypto but the macro is important. A weak dollar correlates with more risk being taken and a strong dollar with less risk being taken. Hence my analysis of the DXY.
In the above chart a couple of things can be seen which makes the outlook hard to predict.
On one side there is a bullflag on the monthly timeframe with a target of 130!
On the other side, looking under we can see a bearish MACD cross and a bearish stoch RSI. On average it takes half a year to a year for a cross like this to recover.
This causes me to be bearish on the dollar and bullish on risk-on assets.
Thanks for reading

ETH - On which side will it break-out?Today, the FED will decide on the interest rate in the USA. It is almost certain (99% probability) that the rate will remain unchanged. The most important aspect to focus on in this meeting’s minutes is the FED Balance Sheet. Will they stop tightening the balance sheet this month, or will they wait until mid-year as stated in January?
Leading up to the FOMC meeting, ETH is squeezing within its 4-hour pattern, forming equal highs and higher lows. This suggests a potential breakout to the upside.
I have outlined two possible scenarios:
1. ETH breaks through the resistance zone with strong volume, then successfully retests it as support.
2. ETH fails to break the resistance zone and instead breaks below the rising trendline.
Scenario 1:
Many stop-loss orders are accumulating just above the equal highs. If ETH manages to break out of the resistance zone with high volume and fill the gap, there is a chance it will flip this resistance into support. To confirm this, we need multiple candle closes above the resistance zone.
However, there is also a possibility that the FOMC meeting could trigger a price pump, only to drop immediately afterward, taking out stop-losses along the way.
Scenario 2:
In this case, ETH breaks below its rising trendline. For this to be a valid breakdown, it must be accompanied by high volume and a new lower low. If ETH breaks the trendline without forming a new lower low, it could be a fake-out. Therefore, we need confirmation: a lower low followed by a trendline retest.
Interesting Observations:
Stochastic RSI on the Daily Timeframe is rising rapidly into the overbought zone, while ETH remains in consolidation. Typically, we want the momentum of the Stochastic RSI to increase alongside price action. However, that is not happening here.
If the Stochastic RSI enters the overbought area and then crosses downward, it could put selling pressure on ETH, potentially leading to new lows in this downtrend.
Conclusion:
My base case is that ETH will sweep liquidity/stop-losses during the FOMC meeting with an initial upside move, followed by a sustainable correction downward in the coming days or weeks, accompanied by a decrease in the Stochastic RSI.
We’ll have to wait and see how the FOMC meeting unfolds.
Thanks for your support!
Drop a like and leave a comment to have a conversation about this topic. Make sure to follow me so you don’t miss out on the next analysis.

AAVE Retests Key Support – Bullish Reversal Ahead?CRYPTOCAP:AAVE is currently retesting a rising support line after breaking through a key resistance zone, which has now turned into support.
This structure suggests that the uptrend remains intact, and the recent dip could be a healthy pullback before a continuation to the upside.
DYOR, NFA

USD/JPY Setup – Buy the Dip or Wait for Confirmation?The USD/JPY pair is testing a long-term trendline support, which has held multiple times in the past, signaling a critical decision point.
The price has bounced off this level before, suggesting strong buyer interest in this zone. Additionally, the Stochastic RSI is oversold, hinting at a potential reversal.
If the price holds above this trendline and key support zone, we could see a bullish continuation toward new highs.

MCHP Long Setup: Oversold Rebound w/ Rising Volatility & VolumeMicrochip Technology (MCHP) is presenting a promising long opportunity for a temporary rebound, supported by three strong technical factors:
Slow Stochastic in Extreme Oversold Territory : The indicator is below 20, signaling excessive selling pressure, often linked to potential short-term recoveries.
Rising Volatility Index (LSVI) : The significant increase in volatility suggests the market is entering a phase of larger price movements, increasing the probability of a sharper rebound.
Increasing Volume with Reduced Decline: Recent candles show higher trading volume accompanied by a slowing rate of decline, indicating potential buyer activity and a technical correction from the recent sharp drop.
With the price near a critical support zone and a target identified at $65.00 (10% gain), this setup offers a compelling risk-reward ratio for short-term traders. If the price crosses above the red line, it may reach $71.00 (20% gain).
Watching for confirmations such as a %K/%D crossover on the Slow Stoch and sustained buying volume will be key to validating this thesis.
Disclaimer : Always manage risk carefully, particularly in high-volatility environments.

This Time Is Exactly The SamePerfect linearity in the Mid-Cycle crossings of the BTCUSD Monthly Stochastic RSI. This Mid-Cycle isn't different this time.
Mathematically it is exactly the same as every other very (overly and early) bullish Mid-Cycle.

I have bought AXS From the AXSUSDT chart, it shows:
Market Trend: The chart is currently in a clear downtrend along the EMA (Exponential Moving Average) line, with the 100-day EMA and 200-day EMA still above the price chart, indicating strong resistance.
Important Support: The support area around 4.145 USD has been tested several times. If the price breaks this support level, it may see a continued correction to the 3.843 USD and 3.831 USD areas, which were previously rebounded.
Stochastic RSI: It is in the oversold zone (below 20), indicating that the market may have a chance to recover in the short term due to weaker selling pressure, but other indicators should confirm it.
RSI (Relative Strength Index): The RSI value at 40.61 is still in the downtrend zone. If the RSI value increases and crosses the 50 line, it may be a sign that the price has a chance to return to the uptrend.
Trading Volume: Trading volume has decreased during the price correction, which may indicate that selling pressure is starting to weaken. Or there are fewer sellers
Entry Recommendation:
Buying at the support level of 4.145 USD should consider waiting for confirmation from Stochastic RSI that there is a reversal from the oversold zone and see if the RSI value can cut through the 50 line. If so, it may be a good time to buy.
Set the stop loss below the important support level at around 4.00 USD to hedge the risk if the price falls below the support level.

Bullish Alert: Tata Technologies|Strong Swing Trade Potential!📈 Bullish Alert: Tata Technologies Ltd. Shows Strong Swing Trade Potential! 🚀
Stock Analysis Report
Stock Name : Tata Technologies Ltd.
Timeframe: Daily
Current Market Price (CMP) : ₹1068
________________________________________
Trade Type
• Trade Type: Swing Trade
________________________________________
Technical Analysis
1. Trendline Breakout:
The stock has recently broken above a key trendline with increased volume, indicating a strong bullish signal.
Following the breakout, the stock has successfully retested the trendline, further
validating the upward momentum.
2. Indicators:
MACD: Buy signal confirmed.
Oscillator: Buy signal confirmed.
3. Moving Averages:
The price is currently trading above both the 50-day and 100-day moving averages, reinforcing the positive trend.
________________________________________
Target Prices
• T-1: ₹1115
• T-2: ₹1150
• T-3: ₹1180
________________________________________
Stop Loss
• SL: ₹1045
________________________________________
Summary : Tata Technologies Ltd. presents a strong swing trade opportunity. The stock exhibits a bullish trend supported by a recent trendline breakout, successful retest, and positive signals from key technical indicators. With the price trading above significant moving averages, potential target prices are set at ₹1115, ₹1150, and ₹1180, while a stop loss is recommended at ₹1045 to manage downside risk.
________________________________________
Disclaimer : " Please do not base your trades solely on the ideas mentioned above. Conduct your own research before making any trading decisions. We are not responsible for any financial losses that may result from applying this study or from taking any early entry or exit in trades. "

$BTC Forecast 3 Day BTC Gameplan
- 3 Day Chart
- 3 Day RSI
- 8 Day Stoch RSI
The game here is to watch the Stoch RSI develop. You need two variables to be true.
1. A cross above the 20 level or cross below 80 level
2. Price Action to support
3. RSI Break

A simple long-term T/F Stochastic Trick You Will Only Learn Here
Cast your minds back to the end of 2015 guys. I know you probably have no recall on the Gold-price.
So let me tell you how the Gold price was behaving at the end of 2015.
For several years prior (approximately) 2012-2015 the Gold Price was trending down to a support level around December 2015.
Now, take a look at the 3 MONTH-Chart for XAU USD. What do you see when looking at the 2nd bottom of chart indicator the Stochastics. Scan from left to right from 2007 to 2024. How many times does it get over-sold under the crucial 20 level. Do you get my drift?
Just prior to December 2015 the Stochastic on the 3M chart crossed-down below the 20 level. But it would've been pressing-down-hard at the floor so you would not be buying yet.
But now, look what happens to price around December 2015 when the 3-MONTH-STOCHASTIC INDICATOR crosses up the Green-20 line. You are correct, price starts to rally-hard.
Forget the so-called gurus selling the b.s. indicators guys. Stochastics and especially on the Higher-Time-Frame is the "KING" of all indicators. It's only let-down is that it does tend to give you a road-map of when to exit your trade. That road-map can be achieved tracking the MACD, which incidentally, the MACD got you into a trade here in Gold not long after the Stochastic crossed-up the 20, there was a Bullish cross-up of the MACD lines. The lower under the zero line this MACD cross occurs. Following the MACD and RSI can actually create a road-map like you are driving a car and trying to avoid an interest, I might explain this another time.
But again, nobody will teach you this trading secret on the Highertimeframes, you will only learn it from the 100% free subscription service delivered by me here at easy_explosive_trades. Just imagine buying 1 lot in XAU USD and capitalising on that 138% move. I have not done the maths.
These are the big trades I look for on the highertimeframes. I started investing and trading during the GFC in 2008 but in 2015 I did not know about this very insider high-time-frame trick using the number 1 indicator, the King-Stochastics, it get you into trades on HTF with needle point accuracy.
Nobody showed me this trick. I work these things out myself. I wanted to share it with you. As I am proud to have you part of my channel.
Cheers,
Chris
easy_explosive_trader
* Trading is risky. Don't rely solely on my investment advice.
Monday's trades: We are bidding up the Silver price & Palladium. Both of these and especially Palladium are bullish on the HTF.
Hey..... forget these gurus with their 72 day moving averages & 171 day moving averages. You make money sticking to the basics in trading.
Finally, I encourage you to, if you take my trades, to always risk no more than 0.25% to 0.50%. I endeavour always to give you fantastic RR not this 1:1 crap that the expensive subscriptions in Gold and Currency's charge. I make enough money trading, I don't need to make money out of you.

$EL | Allocation | Market Exec | Technical Confluences:
- Fibonacci retracement since the beginning of NYSE:EL 's history, puts the price action at the 78% retracement level
- It coincides with a Demand Zone as can be seen across the price history
- Stochastics are in Oversold conditions from Monthly, Weekly, Daily, H4 and even H1
- Will likely put Buy Stop levels at the Interest Zone areas to target a move to the 50% Fibo Retracement of this drastic bear move
Fundamental Confluences:
- Deep discount on a well-renowned brand
- Earnings does not look too good at the moment but they do own some global brands names in beauty care
- Growth can be weak now, but do you see people stop putting on cosmetics and ignore their appearances when they go out? If no, this share is definitely worth a try
________________________________
Putting in 2 portions of my NYSE:EL allocation now with more orders to be placed on in the future
Long-Term value hold in my portfolio.
Remember, DYOR.
________________________________
Boosts 🚀, Follows ✌️, Shares 🙌 & Comments ✍️ are much appreciated!
If you have any ideas or charts, do share them in the 'Comments' section below and we can discuss our perspectives to improve or strengthen our strategies.
If you want something analyzed, do drop me a DM. :D
________________________________
Disclaimer: The above suggestion is an personal opinion in general and does not constitute as investment advice. Any decisions taken based on the above suggestion is purely your own risks. DYOR.

$HIMS | Allocation | Market Exec |Technical Confluences:
- Price action is near the 50% Fibo retracement area
- Price action have bounced off the 200 MA (Red) and has a valid Resistance Trendline with an Interest Zone nearby
- Stochastics is inn Oversold conditions in the Daily & Weekly timeframes
- Elliot Wave 4 seems to be completing at the 50% Fibo line and aim for the 100% Fibo Extension line @ 29.51
Fundamental Confluences:
- Telemedicine with US being a focus market is great as healthcare issues seems to be increasing; demographics start to shift right
- The main health markets that they target are issues that many in the society prefer to remain anonymous about and telemedicine solves that for them
- One negative would be the high expenses they are spending on A&P budgets, a drag but overtime, we can see the impact of what they have been pushing all these while
________________________________
Putting NYSE:HIMS as part of my medical/health category of my portfolio.
Will start my first allocation now and look at adding more into it if price moves into 50% - 61% Fibo range (Interest Zone).
Remember, DYOR.
________________________________
Boosts 🚀, Follows ✌️, Shares 🙌 & Comments ✍️ are much appreciated!
If you have any ideas or charts, do share them in the 'Comments' section below and we can discuss our perspectives to improve or strengthen our strategies.
If you want something analyzed, do drop me a DM. :D
________________________________
Disclaimer: The above suggestion is an personal opinion in general and does not constitute as investment advice. Any decisions taken based on the above suggestion is purely your own risks. DYOR.

$NKE | Allocation | Market Exec & Buy Limit |Technical Confluences:
- Price action is at the 61% Retracement for Recent Lows to Highs and the beginning of Nike's time (Strong Support)
- Price action is also at a Demand Zone
- Stochastics is at Oversold levels on the Weekly & Monthly TF
Fundamental Confluences:
- Regardless of weak Earnings and Forward Projections, Nike is still considered as a market leader in various aspects (Fashion, Fitness, Sports, Status etc.); brand loyalty will be retained at least for the next few years
- Who doesn't love Nike; aside from Adidas?
________________________________
NYSE:NKE is the next in my basket of portfolio. Allocating the first 20% of single-stock into my Long-Term portfolio.
The Nike brand will not die off that easily. Definitely, a value buy; for me.
Remember, DYOR.
________________________________
Boosts 🚀, Follows ✌️, Shares 🙌 & Comments ✍️ are much appreciated!
If you have any ideas or charts, do share them in the 'Comments' section below and we can discuss our perspectives to improve or strengthen our strategies.
If you want something analyzed, do drop me a DM. :D
________________________________
Disclaimer: The above suggestion is an personal opinion in general and does not constitute as investment advice. Any decisions taken based on the above suggestion is purely your own risks. DYOR.

Monthly Chart v. Weekly Chart May Indicate TroubleSince every dollar of price action is raising concern in either direction, let’s take an in-depth look at what’s happening with the price of Bitcoin.
On the weekly chart (left), we can see the RSI is just starting to pivot and we can see the Stochastic RSI will have a cross in the coming weeks, usually indicating an uptrend. Price action has been within the same range for about three months, building healthy market structure. Then we get to the monthly chart.
The monthly chart (right) is showing slowed momentum. We can see in the Stochastic RSI that the orange line is on top of the blue line – usually a bearish indication. This has me a bit concerned and considering how we’ve had ranged price action and are dropping from an RSI of around 80, it may be a warning sign of what's to come.
Take a look at the green arrows on the monthly chart. Every time the purple line crosses above the yellow line, we see a price rally. Now look at the red arrows. When we see the purple line cross below the yellow line, price falls. The first red arrow you see, that was about a 70% drop. The second red arrow you see was about a 52% drop from the next pivot in momentum and a total of a 73% drop once RSI bottomed.
This is when you want to have your strategy in place for if the weekly chart champions the monthly chart or if we do in fact have that RSI monthly purple line cross below the yellow and we go lower. Be ready for whatever the case may be! I'm thinking it's probable we may see a 50% drop before seeing all-time highs and the rally we've all been waiting for.

DON'T FALL FOR IT!! Can you tell me what's next?Every #Bitcoin consolidation since the bottom has had 3 things in common...
1. Each time, it has created a "retail" pattern, such as a wedge.
2. The pattern seemed to #breakout (signaling traders to go long and becoming trapped), only to realize the move as a #fake-out back into the pattern.
3. Then, there seems to be a continuation to the breakdown of the pattern (liquidating late longs and signal traders to go short and becoming trapped), only to deviate back into the pattern just before a massive move to the upside (liquidating the late shorts).
This false move to the downside, so far, has also always correlated to the bottoming of the #StochasticRSI.
The market makers want your bags and this is how they get them.
------
Tell me what comes next... 😏

USDCAD | Short H4 | Market Exe | Loonie to Ride the GreenbackTechnical Confluences for Trade:
- Stochastics are in Overbought Conditions on H1 & H4 time-frame
- Price action is at a Supply Zone area
- Price action may reverse towards the ascending support Trendline
- Targeting the 38.2% Fibo retracement
Suggested Trade:
Entry @ Area of Interest 1.3760 - 1.3800
SL @ 1.3854
TP 1 @ 1.3697 (Close Half-Position & move SL to Entry level once TP1 is achieved)
TP 2 @ 1.3611
Risk-to-Reward @ Approx. 2.12 (Depending on Entry Level)
________________________________
Boosts 🚀, Follows ✌️, Shares 🙌 & Comments ✍️ are much appreciated!
If you have any ideas or charts, do share them in the 'Comments' section below and we can discuss our perspectives to improve or strengthen our strategies.
If you want something analyzed, do drop me a DM. :D
________________________________
Disclaimer: The above suggestion is an personal opinion in general and does not constitute as investment advice. Any decisions taken based on the above suggestion is purely your own risks.
Any websites / brokers / applications suggested here are also provided as informational purpose only.
________________________________

BNBUST | Short H4 | Market Exec |Technical Confluences for Trade:
- Stochastics are in Overbought Conditions on H4 time-frame
- Price action is close to a Resistance Trendline & a Consolidation are
- Price action may reverse back towards the previous Demand Zone
Suggested Trade:
Entry @ Area of Interest 560 - 570
SL @ 580.66
TP 1 @ 552 (Close Half-Position & move SL to Entry level once TP1 is achieved)
TP 2 @ 535.15
Risk-to-Reward @ Approx. 2.18 (Depending on Entry Level)
________________________________
Boosts 🚀, Follows ✌️, Shares 🙌 & Comments ✍️ are much appreciated!
If you have any ideas or charts, do share them in the 'Comments' section below and we can discuss our perspectives to improve or strengthen our strategies.
If you want something analyzed, do drop me a DM. :D
________________________________
Disclaimer: The above suggestion is an personal opinion in general and does not constitute as investment advice. Any decisions taken based on the above suggestion is purely your own risks.
Any websites / brokers / applications suggested here are also provided as informational purpose only.
________________________________

EURNZD | Short H1 | Market Exe |Technical Confluences for Trade:
- Stochastics are in Overbought Conditions on H4 time-frame
- Price action reversed away from Supply area
- Price action may reverse back towards Resistance Trendline and 61.8% Fibo Retracement
Suggested Trade:
Entry @ Area of Interest 1.8100 - 1.8110
SL @ 1.8156
TP 1 @ 1.8057 (Close Half-Position & move SL to Entry level once TP1 is achieved)
TP 2 @ 1.8009
Risk-to-Reward @ Approx. 2.03 (Depending on Entry Level)
________________________________
Boosts 🚀, Follows ✌️, Shares 🙌 & Comments ✍️ are much appreciated!
If you have any ideas or charts, do share them in the 'Comments' section below and we can discuss our perspectives to improve or strengthen our strategies.
If you want something analyzed, do drop me a DM. :D
________________________________
Disclaimer: The above suggestion is an personal opinion in general and does not constitute as investment advice. Any decisions taken based on the above suggestion is purely your own risks.
Any websites / brokers / applications suggested here are also provided as informational purpose only.
________________________________
