Gold: Range Formation or Trend Continuation?Hi, I’m Maicol, an Italian trader.
I study Gold since 2019.
I need your support.
Leave a like and follow me.
It’s a small thing for you, but important for my work.
Please read the description to understand the trading plan.
Don’t focus only on the chart. Thanks.
Live today at 14:00 CET (Rome time).
🌞 GOOD MORNING EVERYONE 🌞
🟡 Gold Outlook
On Friday, gold closed with its typical bullish session.
The question now is simple: can it break the daily shift and continue higher?
This week we have NFP.
At the moment, I see the early formation of a H4 range.
If this is confirmed, the best opportunities will be at the range extremes.
Today is Monday.
Usually a low-decision day for me.
I prefer to wait for the daily close.
Let’s see how price behaves.
-Bullish factors
We come from a daily close bullish
Daily structure is still in a bearish shift
H4 and H1 are currently bullish
🟡 With US data unreliable due to the government shutdown and earnings season still dominating sentiment, gold is moving from forced selling into a stabilization phase.
It remains highly sensitive to yields, USD flows, and equity volatility.
🔑 Key points
The gold selloff was liquidity-driven
Not driven by the Fed or inflation
Tech earnings, especially AI-related, created shocks
Forced selling across assets
Government shutdown = delayed or distorted US macro data
Bond auctions and Fed speakers are now the main drivers
Volatility remains high
Risk is still asymmetric
📍 Bearish pressure is slowing down.
Liquidation is easing.
However, upside momentum is still weak.
Earnings risk and elevated real yields are weighing on price.
For continuation, gold needs one clear trigger:
Equity market stabilization
or
Confirmation from the bond market
For now, I keep these zones.
See you live today at 18:00 for market analysis.
🔍 Reminder 🔍
I avoid trading during the Asian and London sessions.
I focus on the 14:30 news and the New York open at 15:30.
🔔 Turn on notifications so you don’t miss anything.
📬 If you have any questions, message me. I’ll reply.
🔍 NEXT APPOINTMENTS 🔍
As usual, we’ll be live at 14:00 to follow the market in real time.
In the meantime, have a good day.
-GOOD TRADING
-MANAGE RISK
-BE PATIENT
Stocks

NAS100 - Stock market awaits US data!?The index is trading in its descending channel on the four-hour time frame between EMA200 and EMA50. In case of an upward correction towards the channel ceiling, which is also at the intersection of the specified supply zone, we can look for further selling positions in Nasdaq. The decline of Nasdaq towards the demand zone will also create a buying position with a risk-reward ratio.
In the week leading up to February 9–13, 2026, the U.S. equity market enters a phase where earnings from mid-sized yet influential companies may provide a clearer picture of the real economy. From consumer giants such as Coca-Colaand McDonald’s to industrial and technology firms like Ford and Cisco, this week’s data could clarify the trajectory of inflation, consumer demand, and corporate investment.
Youtotimes examines which reports carry the greatest market significance.
The week begins with predominantly industrial-focused releases. Cleveland-Cliffs may deliver the earliest signals about steel, construction, and industrial demand—sectors that typically enter recession or expansion ahead of the broader economy.
However, the key focal point is Onsemi, whose outlook will determine whether automotive and industrial chip markets remain under pressure. Weak guidance from Onsemi could ripple across the entire chain from automobiles to industrial goods.
Tuesday represents one of the most critical days. Coca-Cola serves as a primary gauge of global purchasing power, while Marriott reflects the state of luxury travel—usually the last segment to weaken in an economic cycle.
Within technology, Datadog may reveal whether companies continue spending on SaaS and cloud-monitoring infrastructure.
After the market close, Ford’s financial guidance could shape expectations for the entire auto industry. Zillow will provide insight into the housing market, which has remained largely frozen for months.
Wednesday—arguably the most important day of the week— brings McDonald’s results, a direct barometer of lower-income consumer health. Any sales decline could spark renewed fears of a consumer-led slowdown.
Shopify has the potential to influence the broader e-commerce landscape, while T-Mobile reflects telecom conditions and Kraft Heinz signals food inflation trends.
Most significant, however, is Cisco, whose guidance is widely viewed as a forward indicator of enterprise investment, a critical driver of economic growth.
On Thursday, Applied Materials (AMAT) will indicate whether the AI investment wave has truly reached equipment suppliers. Strong guidance could trigger renewed optimism across semiconductor equities.
Coinbase is likely to move alongside Bitcoin volatility and may show whether retail participation persists.
Meanwhile, DraftKings and Expedia will reflect trends in online gambling and travel demand.
On Friday, Enbridge serves as a key proxy for energy infrastructure and is particularly relevant for conservative investors. Moderna may help define the outlook for biotechnology, while Magna completes the week’s picture of the automotive sector.
Although the companies reporting this week may appear smaller in name recognition, the signals they generate are far larger in implication. From inflation and consumer health to AI, autos, travel, and housing—each report has the potential to shift market direction.
According to the trading calendar, Tuesday brings U.S. December retail sales data, followed by the delayed Non-Farm Payrolls (NFP) report on Wednesday.
On Thursday, weekly jobless claims and January existing home sales will be released.
The week concludes Friday morning with the U.S. Consumer Price Index (CPI) for January—typically a decisive input for inflation expectations and monetary policy.
Meanwhile, the U.S. dollar entered a recovery phase last week, outperforming other major currencies—largely driven by the nomination of former Federal Reserve governor Kevin Warsh as a potential Fed chair. During his 2006–2011tenure, Warsh maintained a hawkish stance on inflation and opposed balance-sheet expansion, making his selection by Trump unexpected for many investors.
Warsh’s proposal to reconsider the relationship between the Federal Reserve and the U.S. Treasury has generated concern in financial markets. While some view it as a step toward greater balance-sheet transparency, critics warn it could weaken monetary independence, alter the inflation path, and threaten the dollar’s safe-haven status.
He has called for revisiting the principles of the 1951 Treasury-Fed Accord, which restored central-bank independence after World War II by removing caps on government bond yields. Warsh argues that the boundaries set by that agreement have eroded in recent years following large-scale asset purchases during the global financial crisis and the pandemic.
However, the lack of concrete details has unsettled investors. Neither Warsh nor Treasury Secretary Scott Bessent has provided a clear framework. Warsh has only suggested that a new structure could better align the Fed’s balance-sheet objectives with Treasury issuance plans.
With federal interest costs nearing $1 trillion and Trump openly pressuring policymakers to consider debt-service costs, markets view this potential alignment as risky.
Some observers believe Warsh will not cross the line of central-bank independence, arguing his aim is merely to enhance transparency and define stricter boundaries for emergency asset purchases.
Critics, however, caution that gradual shifts could evolve into a form of implicit coordination—especially if institutions like Fannie Mae and Freddie Mac also become involved in managing financing costs.

Bitcoin - When History RhymesMarket Context and Historical Symmetry
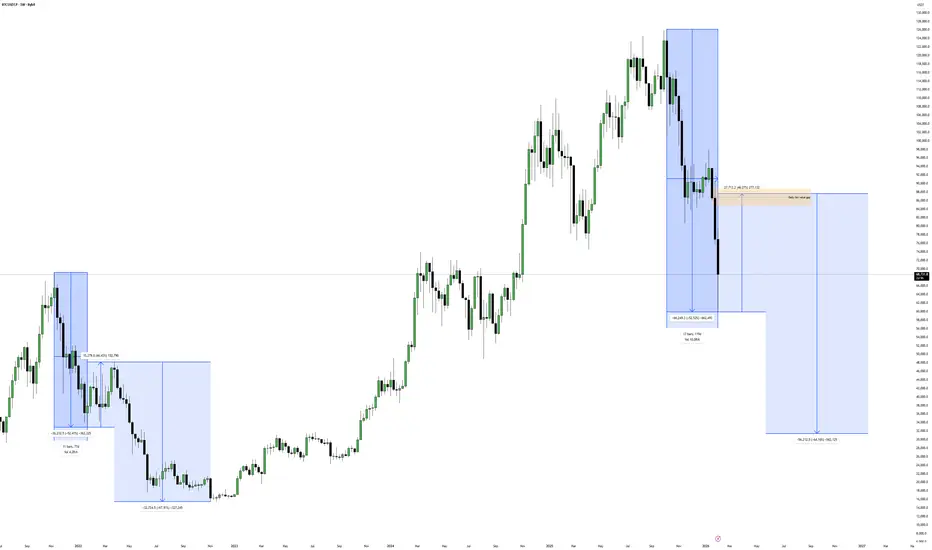
Bitcoin has a tendency to move in recognizable cycles, and what stands out right now is the near-perfect similarity between the previous bull market correction and the current one. During the 2021 cycle, price retraced approximately 52% from the all-time high before establishing a mid term bear market low. That level ultimately became the foundation for the next impulsive expansion.
Fast forward to today, and we are seeing almost the exact same percentage decline from the 2025 all-time high. A 52% correction is not just a random statistic, it reflects a deep but structurally healthy retracement within a broader macro trend. When markets repeat this type of behavior, it often signals that larger participants are positioning rather than abandoning the trend entirely.
Why the Current Zone Matters
The present price region is technically significant because it represents both psychological and structural support. Sharp selloffs typically aim to force weak hands out of the market, while stronger capital accumulates at discounted prices.
If this level holds, it strengthens the narrative that Bitcoin may already be forming its mid term bear market low. What makes this especially compelling is the speed of the decline, capitulation-style moves often precede powerful relief rallies as liquidity flips direction.
This is not about predicting an immediate reversal, but about recognizing that the risk-to-reward profile begins to improve dramatically after a correction of this magnitude.
The 46% Relief Rally Scenario
After the 2021 mid term low was established, Bitcoin rallied roughly 46%. If price were to mirror that behavior again, a similar percentage move from the current low would drive price directly into the Daily Fair Value Gap left behind during the aggressive leg down.
This alignment is important.
Fair Value Gaps act as magnets for price because they represent inefficiencies created by institutional urgency. Markets frequently revisit these zones to rebalance order flow before deciding on the next directional move.
A 46% expansion into that imbalance would not only be technically clean, it would also reflect classic cycle behavior, sharp drop, strong relief rally, then continuation.
Daily Imbalance as the Technical Target
The daily FVG overhead is more than just a chart feature, it represents unfinished business. When price leaves a gap during displacement, it often returns to mitigate it before larger players re-engage.
Should Bitcoin rally into this region, traders should pay close attention to price behavior inside the gap. Acceptance above it would suggest stronger-than-expected bullish momentum, while rejection would reinforce the idea that the broader corrective phase is not yet complete.
Confluence between the historical 46% rebound and the location of this imbalance gives the upside scenario additional credibility.
Cycle Continuation and the 34K Projection
If Bitcoin continues to respect the previous cycle structure, the relief rally would likely be followed by another leg lower. Historically, markets rarely bottom in a single move, they tend to form complex accumulation ranges with multiple expansions and retracements.
Following the analog, a rejection from the daily imbalance could send price toward the 34K region. That area would become a logical candidate for a higher timeframe accumulation phase, especially if liquidity builds beneath it.
This type of sequence, capitulation, relief rally, secondary drop, is characteristic of mid cycle bear markets rather than full macro reversals.
Conclusion
The striking similarity between the previous 52% correction and the current one provides a powerful framework for anticipating potential price behavior. While no cycle repeats perfectly, markets often echo prior structures because participant psychology remains constant.
A relief rally of roughly 46% into the daily Fair Value Gap would be the first confirmation that history may be rhyming once again. From there, traders should remain prepared for volatility, as a subsequent move toward the 34K region could complete the broader corrective pattern before the next major expansion begins.
Recognizing these patterns early allows traders to shift from emotional reactions to strategic positioning, which is ultimately where consistency is built.
___________________________________
Thanks for your support!
If you found this idea helpful or learned something new, drop a like 👍 and leave a comment, I’d love to hear your thoughts! 🚀
ELI LILLY The key 18-month pivot that will decide the trend.Eli Lilly (LLY) has been consolidating since late November 2025 and that's partly thanks to holding its 974.00 Support. That Support was previously a Resistance that was formed after the mid-August 2024 High. Essentially it is a Pivot trend-line that turned from a Resistance to a Support.
As long as it holds, and naturally the 1D MA100 (red trend-line) that sits directly below it, the stock should complete another +38.68% Bullish Leg at least, targeting $1350.
If the stock closes a 1W candle below the Pivot and the 1D MA100, we expect another -36% decline (like late 2024 - 2025), targeting the 1W MA200 (orange trend-line) at $726.50.
It has to be noted that a 1W RSI Lower Highs Bearish Divergence weighs the price more towards the downside.
---
** Please LIKE 👍, FOLLOW ✅, SHARE 🙌 and COMMENT ✍ if you enjoy this idea! Also share your ideas and charts in the comments section below! This is best way to keep it relevant, support us, keep the content here free and allow the idea to reach as many people as possible. **
---
💸💸💸💸💸💸
👇 👇 👇 👇 👇 👇

QQQ Weekly Outlook – Week 6 of 2026 (Feb 09–13)QQQ Weekly Outlook – Week 6 of 2026 (Feb 09–13)
Weekly Recap
Last week, my base projection was that the market would lack a clear directional trend and trade in a range, reacting from key levels. Price behaved exactly as expected, rejecting from those levels and forming short term bounces throughout the week.
Relative to SPY, QQQ was noticeably weaker, which made put side trades significantly more effective on QQQ.
After a strong break and acceptance below 618, we entered puts and shorted QQQ. Price moved quickly, reaching 607 on Wednesday and 599.5 on Thursday, where we took profits.
When price closed back above 599.5 on Thursday, we exited the remaining puts in profit and flipped long with calls. By Friday, those call positions had already started printing gains.
Overall, the execution followed the plan cleanly, and it was a highly profitable week.
Scenarios – Prediction
Bullish Scenario (Likely)
I am tracking two potential bullish paths for the coming week.
Scenario 1:
Price opens with a gap up above 609.5, or breaks and holds above this level with two consecutive 1H candle closes.
In this case, my upside targets are:
616.75 → 630 → 636.5
Scenario 2:
Price fails to hold above 609.5 and pulls back to build energy. A retracement into the 600 or 593 area followed by a bounce, confirmed by price running liquidity and closing above the level with two 1H candles, would be treated as a deviation and signal bullish continuation.
In this case, bullish targets remain:
609.5 → 616.75 → 630 → 636.5
Bearish Scenario
If price closes below 593, I will shift my bias to bearish and look to short the market.
Bearish Target:
580
This level represents the strongest potential bounce zone, so I would plan to close approximately 75% of the position there.
Position Management Notes
I only consider a level broken after two consecutive 1H candle closes above or below it. If price deviates into a level and then reclaims or loses it with confirmation, I treat that as a valid deviation setup.
No trades are taken without confirmation. If price closes back inside the level we assumed was broken or deviated from, again confirmed by two 1H closes, the trade idea is invalidated and positions should be exited.
I share deeper US Market breakdowns and mid week scenario updates on Substack. Link is in my profile.
This analysis is for educational purposes only and reflects my personal opinion. It is not financial advice.

$SPY & $SPX — Market-Moving Headlines Week of Feb 9–13, 2026🔮 AMEX:SPY & SP:SPX — Market-Moving Headlines Week of Feb 9–13, 2026
🌍 Market-Moving Themes
🧠 AI Capex Anxiety Returns
Meta spending leak revives fears that AI margins will lag spending, reopening the hardware vs platform divide
⚙️ Pick-and-Shovel AI Trade
Rising AI budgets continue to funnel into chipmakers and infrastructure suppliers rather than end platforms
📉 Crypto Trust Shock
Weekend Bitcoin exchange glitch damages confidence and raises volatility risk across crypto-linked equities
📊 Data Delay Volatility
Delayed labor data creates a compressed macro week with multiple releases colliding midweek
🛍️ Consumer Stress Test
Retail sales, confidence, and CPI converge to define whether spending is holding up or cracking
📊 Key U.S. Economic Data & Events Feb 9–13 ET
Monday Feb 9
10:50 AM Atlanta Fed President Raphael Bostic speaks
1:30 PM Fed Governor Christopher Waller speaks
2:30 PM Fed Governor Stephen Miran speaks
5:00 PM Fed Governor Stephen Miran podcast interview
Tuesday Feb 10
6:00 AM NFIB optimism index Jan: 99.5
8:30 AM Employment cost index Q4: 0.8%
8:30 AM Import price index Dec delayed: -0.1%
8:30 AM U.S. retail sales Dec delayed: 0.5%
8:30 AM Retail sales ex autos Dec: 0.3%
10:00 AM Business inventories Nov delayed: 0.2%
12:00 PM Cleveland Fed President Beth Hammack speaks
1:00 PM Dallas Fed President Lorie Logan speaks
Wednesday Feb 11
8:30 AM U.S. employment report Jan: 55,000
8:30 AM U.S. unemployment rate Jan: 4.4%
8:30 AM U.S. hourly wages Jan: 0.3%
8:30 AM Hourly wages YoY: 3.7%
10:10 AM Kansas City Fed President Jeff Schmid speaks
2:00 PM Monthly U.S. federal budget: -50.0B
Thursday Feb 12
8:30 AM Initial jobless claims Feb 7: 222,000
10:00 AM Existing home sales Jan: 4.15M
7:05 PM Fed Governor Stephen Miran speaks
Friday Feb 13 — CPI DAY
8:30 AM Consumer price index Jan: 0.3%
8:30 AM CPI YoY: 2.5%
8:30 AM Core CPI Jan: 0.3%
8:30 AM Core CPI YoY: 2.5%
⚠️ For informational purposes only. Not financial advice.
📌 #SPY #SPX #CPI #Jobs #RetailSales #AI #Fed #Macro #Markets #Stocks #Options

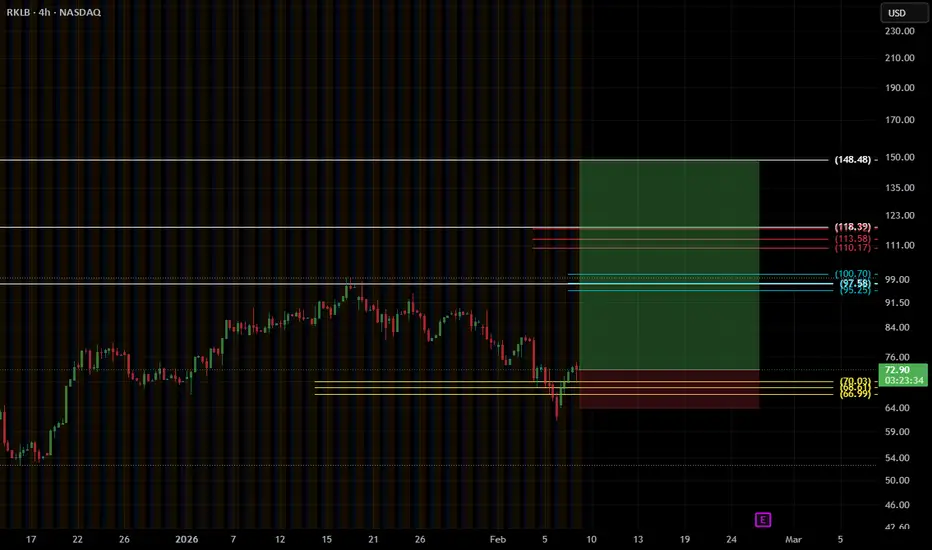
$RKLB , SetupENTRY : CMP
TP1 : 95.25
TP2 : 110.17
TP3 : 148.48
SL : If you wish
My SL is never a SELL, just an alarm to stop adding money and wait for better dca
Follow, Boost, Thank You !!
⚠️ Financial Disclaimer:
This post is not financial advice. I am not your financial advisor, your life coach, or your legally responsible adult.
Always do your own research and never trade based solely on internet comedy.
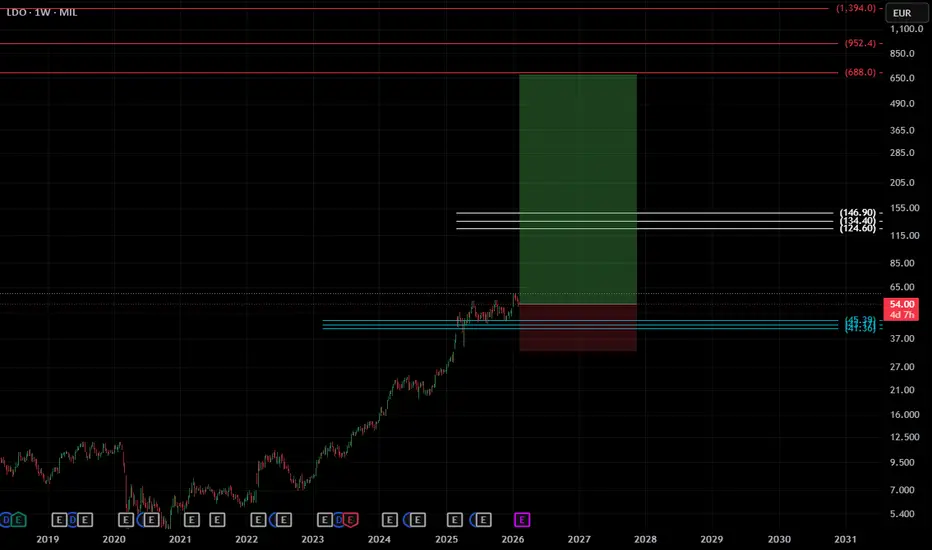
$LDO , Leonardo Milan SetupENTRY : CMP
TP1 : 124.6
TP2 : 146.9
TP3 : Let it Roll !!!!
SL : If you wish
My SL is never a SELL, just an alarm to stop adding money and wait for better dca
Follow, Boost, Thank You !!
⚠️ Financial Disclaimer:
This post is not financial advice. I am not your financial advisor, your life coach, or your legally responsible adult.
Always do your own research and never trade based solely on internet comedy.
LONG TSM: Great point to GO LONG with low risk.TSM is aligned with the current macro and it's part of a sector that won't be heavily affected by inflation. It's main driver is AI and TECH, sectors that are resilient in crisis and sky rocket with tailwind.
For this trade, I'm going long at the open of next candle, the previous current bar already have what I need, including the volume above the 20 SMA of the volume. I'm closing only when a candle closes under the 50 EMA.
My risk for this trade is 2% of portfolio and the initial stop is at the previous swing low.

Netflix Going to 82 or lower? Here is a quick analysis of the market of we are currently seeing, if you need further help and are struggling send me a DM more than happy to answer any questions you may have
Trade Smarter Live Better
Kris

$OII , SetupEntry : CMP
TP1: 32.43
TP2: 39.14
TP3: 53.92
TP4: 68.62
SL : If you wish
⚠️ Financial Disclaimer:
This post is not financial advice. I am not your financial advisor, your life coach, or your legally responsible adult.
Always do your own research and never trade based solely on internet comedy.

SinnSeed | OMS Energy Technologies ( #OMSE ) — 10.02.2026SinnSeed | OMS Energy Technologies (#OMSE) — Company Overview | After IPO
© OMS Energy Technologies
➡️ An oil and gas equipment manufacturer with over 50 years of history has been listed on NASDAQ.
✍️ Company Card
Full name: OMS Energy Technologies Inc. Ticker: OMSE | Exchange: NASDAQ Capital Market Founded: 1972 | Headquarters: Singapore Employees: ~632 people (May 2025) Website: omsos.com
⚙️ Company Operations
OMS Energy Technologies is a growth-oriented manufacturer of equipment for the oil and gas industry. The company specializes in two key product categories: 🗣️ Surface Wellhead Systems (SWS) — surface wellhead systems and "Christmas trees" for controlling oil and gas flow from wells 🗣️ Oil Country Tubular Goods (OCTG) — oilfield tubular products: ▪️ Specialized connectors ▪️ Premium pipes and threaded connections ▪️ Casing and tubing (pump/compressor pipes)
These products are used for drilling, completion, and operation of oil and gas wells worldwide.
🕯 Financial Performance (FY 2025) Total revenue: 203.6 million USD | Growth: +12.21% year-over-year Cost of sales: 134.6 million USD Gross profit: 69.0 million USD Operating expenses: 9.1 million USD Operating profit: around 39.6 million USD
🕯 Balance Sheet: Total assets: 211.68 million USD Total liabilities: 34.51 million USD
📊 The company shows steady growth — revenue has increased from 163.3 million to 203.6 million USD, demonstrating strong operating profitability.
📍 Management ▪️ How Meng Hock — Chairman of the Board & CEO (CEO since 2014, Chairman since March 2024) ▪️ Kevin Yeo — Chief Financial Officer ▪️ Tse Meng Ng — Non-executive Director
🟢 How Meng Hock is a key figure in management and sets the company’s strategic direction.
📈 IPO History ▪️ November 2024 — Submission of confidential documents (Form F-1 to SEC) ▪️ December 2023 — Registration of OMS Energy Technologies Inc. for IPO purposes ▪️ Offering price: 9.00 USD per share ▪️ Exchange: NASDAQ Capital Market, ticker OMSE “Since our founding in 1972, OMS has built its reputation on engineering excellence and strong operating capabilities.” — from the company’s press release. ©
⭐️ Key Takeaways ✔️ Established business — over 50 years in the oil and gas sector ✔️ Financially healthy — low debt burden (liabilities ~16% of assets) ✔️ Sustainable growth — double-digit revenue growth year-over-year ✔️ Strategic location — Singapore as a hub for Asian and global markets
A classic representative of the “old economy” on the modern stock market. Focus on a premium segment with high margins.
🌐 Geography & Clients Key markets: 🇸🇦 Saudi Arabia (Saudi Aramco — anchor client) 🇦🇪 UAE 🇮🇩 Indonesia 🇵🇰 Pakistan
Offices: Singapore (HQ), Saudi Arabia, Indonesia
⚔️ Competitive Landscape Global giants: Schlumberger, Baker Hughes, Halliburton, NOV
OMS Advantages: ✔️ Higher margins vs. competitors ✔️ Niche specialization ✔️ Flexibility and focus on regional markets ✔️ Strategic presence in Singapore
Risks: ⚠️ Smaller scale (capitalization in the hundreds of millions USD) ⚠️ Dependency on major clients ⚠️ High share volatility (but within expectations after IPO)
🚀 Growth Strategy (2025–2026+) ▪️ Expanding in Asia and the Middle East ▪️ Diversifying the client base ▪️ Potential M&A deals ▪️ Expanding the product line
📊 Market Global wellhead equipment market: 5.7–7.6 billion USD Forecast to 2031–33: 9–11 billion USD (CAGR ~5%)
💡Bottom line: #OMS is a compact but high-margin player focused on the premium niche with ambitions for regional growth. It is interesting as a bet on the development of the oil and gas sector in Asia and the MENA region.
Technical Picture: What we know: After the IPO, there is a 📉 correction for 3 to 6 months ⚠️ Sideways between 23.6% and 50% — this is an accumulation or distribution zone. The longer the consolidation, the stronger the breakout will be. The spring is tightening 🔥
🔼 Signs of accumulation (bullish scenario) ▪️ Trading volume declines during declines, rises during upswings. ▪️ Higher lows. ▪️ Dips are quickly bought up. ▪️ RSI forming an upward structure.
🟢 Long conditions: Breakout above the upper limit (50% or 61.8%) on increasing volume + candle closes above the level. Stop-loss — below the lower limit (23.6%).
Short term: 🔹 5.07 (+16%) — Minimal target 🔹 5.70 (+30%) — Standard target ⭐️ 6.15 (+41%) — First key target ⭐️ 6.73 (+54%) — Golden extension
Long term: 🔹 6.25 (+50%) — Minimal target 🔹 7.69 (+75%) — Standard target ⭐️ 8.70 (+97%) — First key target ⭐️ 10 (+124%) — Golden extension

S&P500 Free Signal! Sell!
Hello,Traders!
SPY taps a well-defined supply zone after buy-side liquidity grab. Clear bearish BOS and rejection from premium signal downside continuation toward sell-side liquidity.
--------------------
Stop Loss: 698$
Take Profit: 690$
Entry: 695$
Time Frame: 2H
--------------------
Sell!
Comment and subscribe to help us grow!
Check out other forecasts below too!
Disclosure: I am part of Trade Nation's Influencer program and receive a monthly fee for using their TradingView charts in my analysis.

IONQ Showing Classic Reversal Clues After SweepIONQ is showing a textbook liquidity sweep followed by a strong reaction back to the upside — a pattern that often hints at a potential reversal.
Price recently swept key sell side liquidity before quickly reclaiming higher levels, suggesting absorption and possible accumulation. This type of move typically signals that downside objectives may have been satisfied, with the market now preparing for a structural shift.
The focus this week is on confirmation:
- Do we see continuation with higher highs and supportive structure?
- Or does price reject and return to range?
If momentum holds, this could mark the early stage of a broader push higher. Definitely one to monitor closely as the week develops.
Disclaimer: This is for educational purposes only and not financial advice. Always do your own research (DYOR) before making any trading decisions.

SPY Weekly Outlook – Week 6 of 2026 (Feb 09–13)SPY Weekly Outlook – Week 6 of 2026 (Feb 09–13)
Weekly Recap
Last week, my core projection for SPY was that price lacked a clear directional bias and would trade within a range, reacting from key levels. Price behaved exactly as expected throughout the week, rejecting from those levels and forming short-term bounces.
The framework was simple and worked very well:
If price takes liquidity from a key level and closes above it → buy calls and target the next higher liquidity level.
If price fails to hold the level and closes back below → exit calls, buy puts, and target the next lower key level.
This structure played out cleanly. After 687.25 broke and price closed below it, we shorted SPY and entered puts. Profits were taken sequentially at 684.75 and 676.5.
Once price found a bounce at 676.5, the remaining put position was stopped, and we flipped long into calls on Thursday, anticipating a bounce. That long positioning paid off very well into Friday.
Overall, execution aligned perfectly with the framework, making it a highly successful week.
(For reference, last week’s SPY outlook is shared as a linked idea.)
Scenarios – Prediction
Bullish Continuation (Likely)
I am tracking two possible paths for bullish continuation next week. For SPY to resume its move toward all-time highs, the 690 level must be reclaimed.
Scenario 1:
Price breaks above 690 and secures acceptance above it (a gap up open also qualifies).
In this case, I expect price to move quickly early in the week toward 697.75 and 700.
Bullish Targets:
697.75 → 700
Scenario 2:
Price fails to break 690, pulls back to build energy, and finds support in the 685–680 bounce zone.
If price bounces from this area and creates deviation:
Bullish Targets:
690 → 697.75 → 700
Bearish Scenario
If price breaks and accepts below 675.5, I will consider SPY to have shifted into bearish mode.
In that case, all call and long positions should be closed, and bias should flip to puts.
Bearish Targets:
669 → 649
Position Management Notes
I only consider a level broken after two consecutive 1H candle closes above or below it. If price deviates into a level and then confirms by closing above or below, I treat that as a valid deviation setup.
No trades are taken without confirmation. If price closes back inside a level we assumed was broken or deviated from, again confirmed by two 1H closes the trade idea is invalidated and positions should be exited.
I share deeper US Market breakdowns and mid week scenario updates on Substack. Link is in my profile.
This analysis is for educational purposes only and reflects my personal opinion. It is not financial advice.

Amer Sports ($AS) Breakout: Bull Flag Measured Move to $48NYSE:AS is printing a textbook continuation pattern.
After a 30% rally, the stock is catching its breath in a tight flag.
Volume is drying up on the consolidation—exactly what you want to see before the next leg up.
Every young fashionable Girl is wearing Salomons, and the chart is reflecting it.
#BullFlag, #Breakout, #Gorpcore, #GrowthStocks

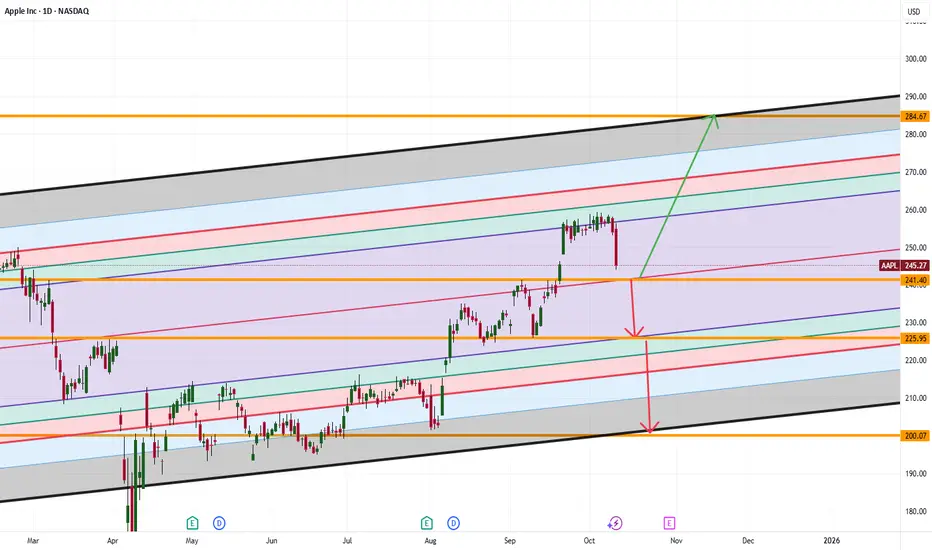
Apple’s $241 Bounce or Breakdown: Is This the Next Big Move?Apple’s stock price is moving down toward $241. This is an important zone. If Apple can stay above $241, it could jump up to $284. But if it falls below $241, the price might drop even more; maybe to $225 or even $200.
What do you think will happen next? Would you buy Apple if it drops to $241, or would you wait for a bigger move?
If you’re not sure what to do or have questions, ask me! Sometimes asking the right question gives you the answer you need to trade smarter. What’s your question about Apple right now?
Mindbloome Exchange
Trade Smarter Live Better
Where Should We Look To Enter A Silver Trade or HODL?Trading Fam,
All is going as anticipated. Updates are really not necessary if you've been following me. I called the Dollar crash, Bitcoin crash, and a pullback that is still to come in the U.S. stock market. So, we'll touch briefly on these charts again by way of re-visit, but the primary focus of this video will be SILVER. Where do we look to enter, re-enter, or buy and hold for the long term? Let's dive in.
✌️Stew

$BMNR: The $161 Ghost Top – Will the Great price void be filled?💀📉 💀📉
We need to talk about #BMNR.
Tom Lee’s vision of an 'Ethereum Treasury' is a grand experiment, but for retail investors, it’s becoming a house of mirrors.
The Trap: Thousands of retail accounts are trapped at the $100+ entry levels. With the current price at $25, the psychological damage is already done.
The Gap: Look at the monthly chart. There is a massive, unfilled gap from $12.38 down to the $4.57 zone.
The Reality: $4 billion of unrealised losses on just $79.3M in revenue is not a business; it's a high-stakes bet with YOUR capital. $200M stake on youtuber is a massive gamble. Completely unrelated to bringing Tradfi on chain.
Warning: If we lose the $24.33 support, the next unfulfilled targets will likely be met.
With $16.70 a high conviction probability imho.
#BMNR #TomLee #Ethereum #StockMarketCrash #RetailTrap #DilutionWarning
📉 3 Red Flags
1. The "Split-Adjusted" Illusion & High-Price Trap
The stock reached an all-time high of $161 earlier in the year but is currently trading around $25.10.
The Danger: Retail investors who "bought the top" are now sitting on 84% losses.
The Gap: There is a significant technical gap back toward the $3.20 - $5.00 range (the 52-week low). If the market loses faith in the "Ethereum Treasury" narrative, the stock could gravity-pull toward its DCF (Discounted Cash Flow) fair value of just $0.18.
2. The "Alchemy of 5%" vs. Extreme Dilution
Tom Lee’s strategy, "The Alchemy of 5%," aims to control 5% of the total ETH supply.
The Dilution: To fund this, Lee recently asked shareholders to approve a 100x increase in authorised shares—from 500 million to 50 billion.
The Warning: While Lee claims this keeps the share price "reasonable," it effectively ensures that current retail holders will be massively diluted unless ETH prices go parabolic immediately.
3. The Financial "Flippening"
The company’s latest financials (Q1 2026) showed a staggering $5.2 billion net loss, flipping from a profit just one quarter prior.
Fragile Model: Despite having $14 billion in assets, the revenue from staking.
Is only revenue if sold for Dollars.
He made himself a Eth whale --- where dumping is part of the business model.
The Risk: This creates a situation where the stock trades purely on the sentiment of ETH, but with the overhead of a massive corporate cash-burn.

S&P 500 Daily Chart Analysis For Week of Feb 6, 2026Technical Analysis and Outlook:
The Index exhibited notable volatility during the trading session this week, reflecting one of the most robust rebounds observed to date. It has stabilized above the Mean Support level of 6,892 and below the Key Resistance level of 6,993.
It is anticipated that the Index will continue its upward trajectory toward the target of the Outer Index Rally at 7,026, while helming through the newly established Key Resistance level at 6,993.
However, it is imperative to acknowledge that, given the prevailing market conditions, there is a substantial likelihood of a retracement that may lead to revisiting the Mean Support at 6,892, prior to the Index regaining its bullish momentum and progressing toward the projected outcome of the Outer Index Rally at 7,026. At this stage, an In Force retracement is expected to be initiated from that completed target.

Quick Trade on PATHTechnical bottom on PATH and Reversal Candle pattern
RSI rebound
This is a TRADE not an INVESTMENT.
Entry 12.6-13
TP @ 15.2
SL @ 11.4

Clear double Top on AMD - Ready Buy LimitsClear double top
Gap always closes
This trade is placed to catch a falling knife
Ready buy limits at 160
TP @ 260

Buy the Dip on Amazon
BUY @ 200-210
Long hold
Still waiting for AMZN to catch up on the AI race, they have such great sticky ecosystem for leveraging AI integration in robotics, automation and IOT.
Not to mention the lacklustre monetization in their existing robotics arm.
On this aspect it is possible for almost full replacement of headcounts in AMZN's fulfilment centers with automation and robotics - hence heavy decrement in recurring manpower costs.
I foresee an amazon Trainium resurgence from Anthropic's collaboration with AWS.
Overall, adding a big bag to this one
