Bitcoin - Approaching the Make or Break ZoneBitcoin continues to bleed lower after multiple liquidity sweeps, and the decline is beginning to compress into a more controlled down move. The chart shows a clear shift in sentiment after the all time high sweep, then another daily sweep that helped close both the daily and 4H imbalance. Since losing the mid range zone and treating it as resistance, the market has been trending toward the next major area of interest.
Consolidation Structure
The structure is currently defined by a clean series of lower highs combined with sharp impulsive down legs. These moves are driven by liquidity grabs followed by displacement, which fits the narrative of a market hunting demand. The previously supportive gray zone has now flipped into resistance, confirming that the current trend remains heavy until a deeper demand zone is reached.
Key Support Zone and Expectations
The most important area beneath price sits around the seventy two thousand to seventy five thousand range, which is the closest meaningful support left on the higher time frame. This zone has been untested since the last major accumulation phase, and as long as price reaches it with a clean move, the reaction can form the base for a bullish leg. If this zone fails to hold, the next meaningful support sits deeper, and the downside extension could accelerate before any recovery starts.
Bullish Scenario
If Bitcoin reaches the seventy two thousand to seventy five thousand range and prints a clear rejection with displacement back upward, the market can set the foundation for a strong bullish bounce. Ideally, we see a final liquidity sweep beneath that range, followed by a sharp market structure shift on the lower time frames. That would open the door for a sustained recovery toward the mid range inefficiencies left behind during the selloff.
Bearish Scenario
If the key zone does not hold, the current support gives way and the market moves into a much deeper discount. That would shift the bias toward continuation lower, targeting untouched liquidity pools further down. In this scenario, any attempt to bounce would likely be corrective rather than the start of a true reversal.
Conclusion
I expect Bitcoin to deliver a meaningful bullish bounce once the seventy two thousand to seventy five thousand zone is tapped, as long as the level holds cleanly. If it fails, the decline continues into a deeper support, but the higher time frame idea remains that the next strong reaction will come from that region. Until then, patience is key while the market completes the move into higher time frame demand.
___________________________________
Thanks for your support!
If you found this idea helpful or learned something new, drop a like 👍 and leave a comment, I’d love to hear your thoughts! 🚀
Community ideas

Saylor’s Master Plan at Risk? MSCI Drops the HammerMSCI May Exclude Crypto-Heavy Companies: What It Means for MicroStrategy and the Market
MSCI recently published a proposal that could dramatically reshape how global indices treat companies with large crypto exposure.
According to the framework, companies holding more than 50% of their market capitalization in digital assets may be excluded from national and international indices.
This sounds technical - but the consequences are huge.
What This Means in Practice
If the rule is implemented, companies like MicroStrategy, Bitfarms, Marathon, Hut8, Coinbase, or any firm holding a large percentage of crypto on their balance sheet, may:
be excluded from major indices,
lose exposure to institutional investors,
be off-limits for pension funds, insurers and conservative hedge funds,
face reduced liquidity and forced selling.
This is not a small development.
This is a structural shift.
🧩 Why MicroStrategy Is the Most Exposed
MicroStrategy’s business model has been extremely straightforward:
issue new shares
raise debt (including convertible notes)
use the proceeds to buy Bitcoin
rising BTC → rising MSTR
rising MSTR → more borrowing capacity
A perpetual loop.
But if MSTR gets excluded from key indices, the loop breaks:
passive funds must sell
institutional investors face compliance risk
liquidity dries up
volatility increases
borrowing costs rise
And remember:
MicroStrategy currently trades below the fair value of its Bitcoin holdings.
A forced outflow amplifies the structural imbalance.
⚠️ Why Institutions Bought MicroStrategy Instead of Bitcoin
Many funds legally cannot buy Bitcoin.
They also cannot buy high-risk crypto exchange stocks like Coinbase.
But they can buy:
reputable corporate debt
convertible notes
equity from a listed U.S. corporation
Michael Saylor gave them a regulatory loophole:
“Want Bitcoin exposure? Buy my convertible debt.
If BTC rises, convert the notes into shares.”
This workaround is now cracking.
Convertible Debt Holders Are in a Tough Spot
If MSTR is excluded from indices:
index funds sell → share price drops
falling price → convertible notes lose value
institutions holding the debt face losses
the balance sheet risk increases
This is why regulatory decisions matter so much.
Insider Selling: VP of Bitcoin at MicroStrategy Sells ~$19.7M Worth of Stock
The timing is… interesting.
Started selling on September 18
Sold options-based shares in multiple lots
Continued selling until November 14
Total realized profit: ~$19.69M
Selling into regulatory uncertainty is not random behavior.
It’s a signal.
Key Takeaways
1. MSCI’s proposal changes the rules:
companies with >50% crypto exposure may become “non-indexable”.
2. MicroStrategy’s core model—borrowing to buy BTC—depends on institutional inflows.
Index exclusion disrupts it.
3. Convertible note investors may face severe pressure.
4. Insider selling suggests internal awareness of structural risk.
5. If MSTR is removed from indices, forced selling could create significant downside pressure.
📉 Conclusion
MicroStrategy has long been a “Bitcoin ETF before ETFs existed”.
Institutions bought MSTR because they couldn’t buy BTC directly.
But now:
Bitcoin ETFs exist,
regulations are tightening,
index providers are updating risk frameworks.
MicroStrategy may become a victim of its own success strategy.
Best regards EXCAVO

NQ Targets (11-24-25)The downtrend is on and will play inside the Diablo's (red diagonal lines) until breakout. 24,600 to 24,056 is Churn Zone and 24,708 and 24,226 are KL's to watch for opposite direction trades 1st and follow through 2nd. NAZ did come close to -10% level in the overnight, popped back up on a Friday (typical). The original Short call was aiming at all the O/N gaps up from prior Rig lift (from O/N), these have been cleaned out. The NDX chart will show these that started on 10/24 through 10/29. Note, from here the math gets interesting and can be illustrated on the NDX chart. We may see heavier selling in the O/N as 11/20 was an outside day reversal close. Notice on the NDX chart that the recent 58% lift can erased will only a 37% drop and the YTD 24% high is erased will only a 19% drop. Heavy volume lower after light volume (off session) lift. Keep in mind that the O/N has a new limit down of -7% (old was -5%). Keep in mind the drawdown math effect = pain. Unless we see a retest that can get above NDX Danger Zone and get back above the Upper TZ or long term trendline (orange, 25,095). NDX 25,095 - 23,233 is Churn Zone until breakout. NQ - NDX differential is about 200 points.
NDX Chart

AIA 0.07 i think it will do something SEXYa measured move to reset
yet when it recovers
it shall be so fast that it will leave everyone behind
NFA
just guessing

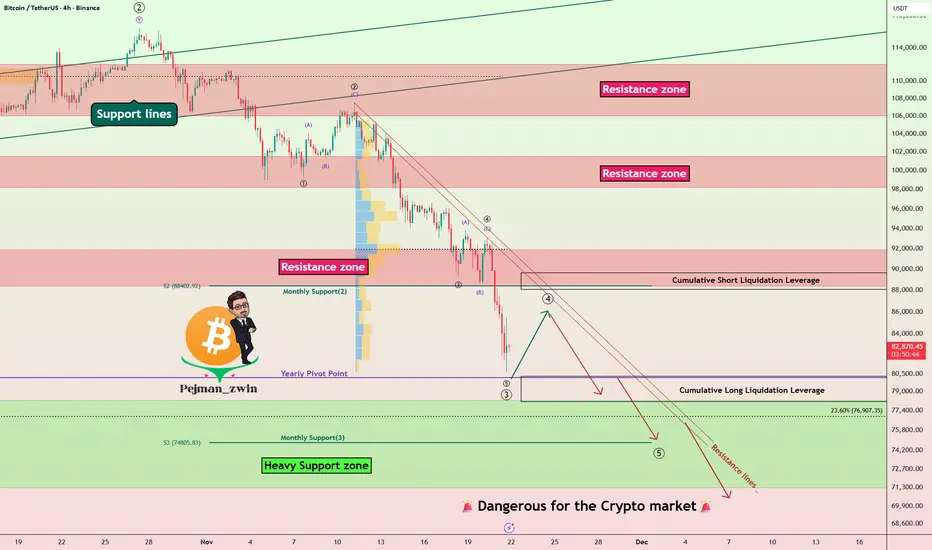
Bitcoin Hits Heavy Support Zone — Is the Next Big Crash Coming?Recently, Bitcoin ( BINANCE:BTCUSDT ) experienced another decline of over -10%, largely due to the sudden drop in the S&P 500( SP:SPX ). As I mentioned in previous ideas, in recent weeks, Bitcoin and the crypto market, especially Bitcoin, have shown a strong correlation with U.S. indices, particularly the S&P 500. This means that even technically sound analyses for Bitcoin can fail if we don’t consider these external factors, which is quite normal. Therefore, it’s crucial to incorporate all parameters—news, fundamentals, on-chain data, and relevant indices—to get an accurate Bitcoin analysis. This complexity can make things a bit challenging.
Over the past ten days, Bitcoin has swiftly broken through several support levels. Many factors have contributed to Bitcoin’s decline recently, but it’s now approaching a heavy support zone($78,300-$71,280). This zone is crucial because if Bitcoin loses it, we could see even larger declines, affecting altcoins as well. Altcoins, in general, haven’t matched Bitcoin’s gains in recent months, so a significant drop in Bitcoin could lead to severe losses for them. It’s essential to manage your investments carefully and stay alert.
From an Elliott Wave perspective, the recent decline suggests that Bitcoin might be in the midst of a five-wave downward, which isn’t positive news. There’s a chance that the heavy support zone($78,300-$71,280) might be breached. However, considering that weekends typically have lower trading volumes, it’s less likely that the support will break in the next couple of days. Still, we must remain vigilant and prepared for any scenario.
In terms of Elliott Waves, it seems Bitcoin has completed its main wave 3, and we might be looking at the completion of the wave 4 over the weekend, with another push towards the heavy support zone($78,300-$71,280) at the start of next week.
Also, the USDT.D% ( CRYPTOCAP:USDT.D ) chart looks bullish, which could not be good news for Bitcoin.
I expect that after a brief rebound, Bitcoin will resume its decline and test the heavy support zone($78,300-$71,280) again.
Cumulative Short Liquidation Leverage: $89,642-$88,079
Cumulative Long Liquidation Leverage: $80,263-$78,131
First Target: $78,523
Second Target: $75,123
Stop Loss(SL): $92,123(Worst)
Points may shift as the market evolves
Note: The S&P 500 also might face downward pressure in the coming days, which could further impact Bitcoin’s support levels. It’s essential to manage your investments carefully and wait for strong reversal signals in higher timeframes. You might miss out on some short-term gains, but it will allow for more confident entries later on.
Note: Tensions between the U.S. and Venezuela are escalating day by day. Should these tensions intensify to the point of direct confrontation, it could act as a trigger for another Bitcoin decline. It’s important to keep this in mind.
Note: Additionally, there have been some suspicious transfers involving the Mt. Gox exchange recently. It’s worth monitoring these developments closely.
💡 Please respect each other's opinions and express agreement or disagreement politely.
📌Bitcoin Analysis (BTCUSDT), 4-hour time frame.
🛑 Always set a Stop Loss(SL) for every position you open.
✅ This is just my idea; I’d love to see your thoughts too!
🔥 If you find it helpful, please BOOST this post and share it with your friends.
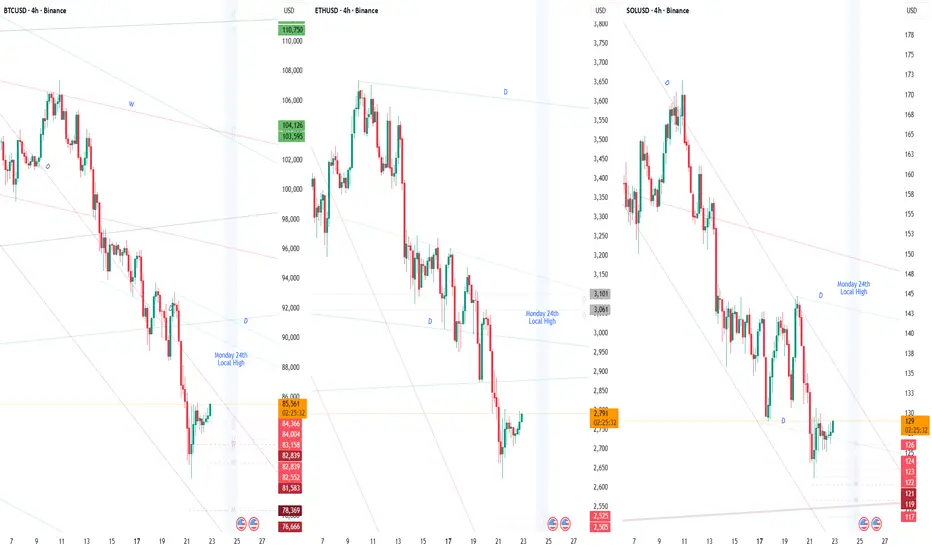
BTC ETH SOL Collapse Is Only Getting StartedI genuinely feel the pain of every crypto long term holder. I've been in crypto since 2014 and already suffered my losses back then. I no longer hold anything long term, when the trend changes, I go SHORT.
This is NOT FINANCIAL advise. You can quickly open an account on any brokerage that offers SBIT and ETHD ETFs -2x SHORT and buy this Monday night. I'm sorry to say but, this collapse is only warming up. DO NOT BUY ANY DIP unless you're a professional trader!
BTCUSD Next Buying Move AnalysisPrice is sitting inside a strong demand zone.
If BTC breaks below this support, more downside can open.
But if it holds, expect a pullback toward the mid-resistance zone, and only a break above that can target the upper resistance.
Focus Levels
Support: Current lower pink zone
Resistance: Mid-zone + upper target zone
Trend: Bearish unless a strong reversal candle forms
Please kindly support with Boost and Comments.

STRK USDT SHORT SIGNAL---
📢 Official Trade Signal – STRK/USDT
📉 Position Type: SHORT
💰 Entry Price: 0.1766
---
🎯 Take-Profit Targets (Partial Exits)
TP1 = 0.1591
TP2 = 0.1470
TP3 = 0.1363
TP4 = 0.1259
TP5 = 0.1135
TP6 = —
---
🛑 Stop-Loss: 0.1895
📊 Timeframe: —
⚖️ Risk/Reward Ratio: 7.87
💥 Suggested Leverage: 5× – 3×
---
🧠 Technical Analysis Summary
STRK is showing strong bearish pressure after failing to hold above the 0.18 resistance zone.
The market structure has shifted downward, with lower highs forming and momentum clearly favoring sellers.
Key confirmations for the SHORT setup:
Breakdown of key support near 0.17
Increasing selling volume around resistance re-tests
Clear bearish trend continuation pattern
Liquidity gaps below price indicating downside potential toward 0.159 – 0.136
Momentum indicators showing declining strength and bearish divergence
The listed targets align with major demand zones, liquidity pockets, and historical reaction levels.
---
⚙️ Trade Management Rules
✔️ Take partial profit at TP1
✔️ Move Stop-Loss to Break-Even once TP1 is hit
✔️ Trail SL lower as price approaches TP2–TP5
✔️ Do not re-enter if stop-loss is hit at 0.1845
✔️ Stick to the planned risk — no overleveraging
---
⚠️ Important Risk-Management Note
When price touches TP1, immediately move the SL to the Entry Price.
This is a standard professional rule to eliminate risk.
❗ If the price pulls back and closes the position at break-even after TP1, this does not count as a losing trade — it means the setup was managed safely.
🔐 Always protect capital first. Profit comes after risk is controlled.
---
📌 TradingView Hashtags
#STRKUSDT #STRK #CryptoSignal #ShortSetup #TechnicalAnalysis
#FuturesTrading #Altcoins #TradingView #ProSignal #ScalpSetup
---

Bitcoin: Where Is The Bottom?Bitcoin sell off continues through the 90K to 88K support area. There have been no reversal confirmations on this time frame since I wrote my previous report. The reversal pattern that I was anticipating never even began to materialize. Trade opportunities were best found on the day trade time frames in my opinion. Why wasn't anyone calling for such a move back in August? All of the "experts" who seem to always know the future, until something like this comes along? This is why I don't forecast the future, instead I do my best to uncover potential risks which can lead to capturing potential opportunities.
88K is where I labeled Wave 1 of the broader 5th wave which I talked about for months. I warned investors that buying and attempting to hold above 100K was high risk. Bitcoin is NOW at prices worth monitoring for longer time horizon investing, BUT price has compromised the 88K overlap level. I interpret as we are no longer in the broader Wave 4 and instead, the Wave 5 of 5 is likely complete. There is a much lower chance that we get the dramatic rally into the 130Ks as a result.
This change in expectation is what guides how I gauge investment potential, which then shapes my strategy and goals. 73K is a MAJOR support level (previous all time high before the election) and it is now much more possible to be tested. IF there is any confirmed reversal before reaching this support, profit potential for SWING trades can be measured from the next series of resistances 95K, 100K, and 105K respectively. The 88K overlap suggests that Bitcoin is now in a broader Wave 2 which is likely to unfold in a long term range. A range low is more likely and has yet to be established. It could be 73K, it could be lower like in the 60Ks. SENTIMENT drives price over the short term which is why fundamentals alone are not enough.
There are many ways to begin accumulating Bitcoin inventory or acquiring exposure without buying Bitcoin itself. There's a entire collection of ETFs that track Bitcoin that have low cost fees. There are also other stocks that are highly correlated to Bitcoin but have their own unique characteristics which can enhance performance or help to mitigate some of the risks of buying Bitcoin itself. COIN is one of many examples. I would rather accumulate shares of a stock which is easily accessible and straightforward than accumulating Bitcoin itself simply out of convenience. I will talk more about this during my regular stream.
The illustration on my chart is ONE of many scenarios to consider for the coming weeks. While 73K is a possibility, I like it is a low probability that price will probe that low without attempting to retrace first. There is a pin bar in place but still lacking confirmation on this time frame. I believe there is a much higher chance of reversal from the current prices, BUT I do not expect an attempt at new all time highs any time soon. WAIT for confirmations, set profit objectives and keep expectations within the boundaries that are set forth by the PRICE STRUCTURE, not "experts" whose only agenda is to convert your attention into a paycheck.
Thank you for considering my analysis and perspective.

EURUSD Poised for Further Downside as Bearish Structure HoldsEURUSD Poised for Further Downside as Bearish Structure Holds
From our previous analysis, EURUSD reached our first target and found a strong support near 1.5300
EUR/USD continues to trade within a clear bearish structure after breaking down from the large symmetrical triangle formation earlier this month.
The pair is struggling to gain bullish traction, and every short-term recovery has been met with selling pressure.
Price is currently retesting the minor support area around 1.1530, but momentum remains weak.
The next support levels to watch are:
🔹 1.1470
🔹 1.1400
As long as the pair remains below 1.1665 resistance, the overall outlook favors further declines.
You may find more details in the chart!
Thank you and Good Luck!
❤️PS: Please support with a like or comment if you find this analysis useful for your trading day❤️

Smart Money Liquidity Trap Explained⭐ Smart Money Liquidity Trap Explained
✨ A deep dive into how institutions manipulate price before major moves ✨
In every financial market — Forex, Crypto, Stocks, Indices — price doesn’t simply move at random. Behind the scenes, Smart Money (institutions, banks, hedge funds) engineer setups that allow them to enter positions at the best possible price. One of their most effective tools is the Liquidity Trap.
Let’s break it down beautifully and clearly. 👇
🔥 What Is a Liquidity Trap?
A Liquidity Trap occurs when Smart Money deliberately pushes price into areas loaded with:
❌ Stop-loss orders
📉 Sell-side liquidity
📈 Buy-side liquidity
😰 Emotional retail entries
🔥 Breakout traders placing pending orders
These areas become liquidity pools — perfect fuel for institutions to fill their massive positions.
Retail traders think it’s a breakout…
But Smart Money thinks:
➡️ "Thank you for the liquidity."
🧩 How Smart Money Creates the Trap
1️⃣ Phase 1: Build the Setup
Smart Money guides price slowly toward an obvious level:
A clean high
A clean low
A trendline
A double top/bottom
Retail traders get excited:
📢 “Breakout coming!”
But institutions are simply gathering attention.
2️⃣ Phase 2: The Liquidity Grab ⚡
Price spikes violently above/below the obvious level.
This move triggers:
🟥 Stop-loss hunts
📉 Forced liquidations
💥 Breakouts that fail instantly
This sudden spike gives institutions the liquidity needed to place large buy or sell orders without causing massive slippage.
This is why the spike is often fast and dramatic.
3️⃣ Phase 3: The Real Move Begins 🚀
After the liquidity is collected, price reverses sharply.
This is the moment Smart Money actually commits to the real direction.
Retail traders feel:
🤯 “Why did it reverse?!”
😭 “I got stopped out for nothing!”
😵 “The breakout was fake!”
But Smart Money simply executed their strategy perfectly.
🎯 How to Use Liquidity Traps in Your Trading
Study where retail traders commonly place:
⛔ Stops
📌 Breakout orders
❗ Predictable entries
Then wait for the fast liquidity grab followed by:
A displacement 🎇
A sharp wick rejection
A structure shift (CHoCH / BOS)
These signals often reveal the true direction of the upcoming move.
💡 Key Features of a Smart Money Liquidity Trap
✨ Sudden spike into obvious areas
✨ Fast liquidation and stop-hunting behavior
✨ Sharp wick rejections
✨ Structure shift after the spike
✨ Smooth continuation in the real direction
🚀 Why This Concept Is So Powerful
Recognizing liquidity traps allows you to:
❌ Avoid fake breakouts
🛡️ Protect yourself from stop-hunts
🎯 Enter the market at premium/discount levels
🤝 Align with Smart Money
💼 Improve long-term consistency
This is how professional traders stay on the right side of volatility — by understanding why the market moves, not just where it moves.
USDT DOMINANCE Analysis | Altseason Or New Bearish Cycle (3D)Before anything else, pay close attention to the timeframe. This analysis is based on the 3-hour timeframe, and it naturally takes time to unfold.
From the point where we placed the red arrow on the chart, it seems that the correction of USDT dominance has begun. This correction is forming a Diametric pattern, and we are currently at the end of wave F.
From the red zone, we expect a rejection to the downside, because wave F ends in this area and we will enter wave G, which is a bearish wave. During this bearish wave, Bitcoin and altcoins will experience some degree of recovery.
However, based on NeoWave wave-counting principles, in the green zone either:
* The correction of USDT dominance will be completed and it will enter a mid-term bullish phase, leading Bitcoin and altcoins into another bearish cycle,
or
* Wave G of this USDT dominance pattern will extend, and instead of a new bullish phase, an X wave will form. In this scenario, USDT dominance will enter another downward cycle, which could trigger an altseason.
We have to see which scenario plays out!
What do you think?
Comment if you have any questions
Thank You

SOLUSDT: Liquidity Tightens – Every Pullback Drops Even Deeper!When talking about Solana right now, the clearest feeling is that the market is losing strength day by day . Recent news shows that SOL has dropped sharply in November, and large capital keeps exiting the market — turning every bounce into an excuse for holders to sell rather than a sign of reversal.
On the H4 chart, SOL is trapped inside a descending wedge , repeatedly rejected by the Ichimoku cloud — an area that has consistently blocked every recovery attempt. Each previous bounce has only led to an even stronger downward leg.
The $130 level is the nearest immediate resistance and also aligns with the descending trendline. If price pulls back to this zone, there is a high probability of fresh selling pressure emerging. When that happens, SOL could continue dropping toward the psychological support at $100 — the key target in the current bearish outlook.
In summary, with both negative news and a weak technical structure, the most reasonable strategy now is to follow the downtrend , wait for price to pull back into resistance to find cleaner entries, and avoid catching bottoms when the market shows no clear reversal signals.

Bearish Case To $375This 4H Chart shows a potential downward move to $375. Price has just broken the neckline of the second consecutive M pattern (Mtop), thus making this next downward move more extreme than the first. Please see the first M pattern in orange with a clear white neckline that was broken with a measured move down from the breakpoint to the next pivot low where price reversed, trended upwards to start forming the move up for the second M pattern to form. The second M pattern in light blue has now formed and broken below its neckline in white, with a duplicated measured move down added from first M pattern neckline. Notice how the second measured move down coexists with a strong upsloping trend line. There is also an upsloping parallel channel that has been broken. Also, negative divergence on RSI. Lastly, notice my projected path down in white.

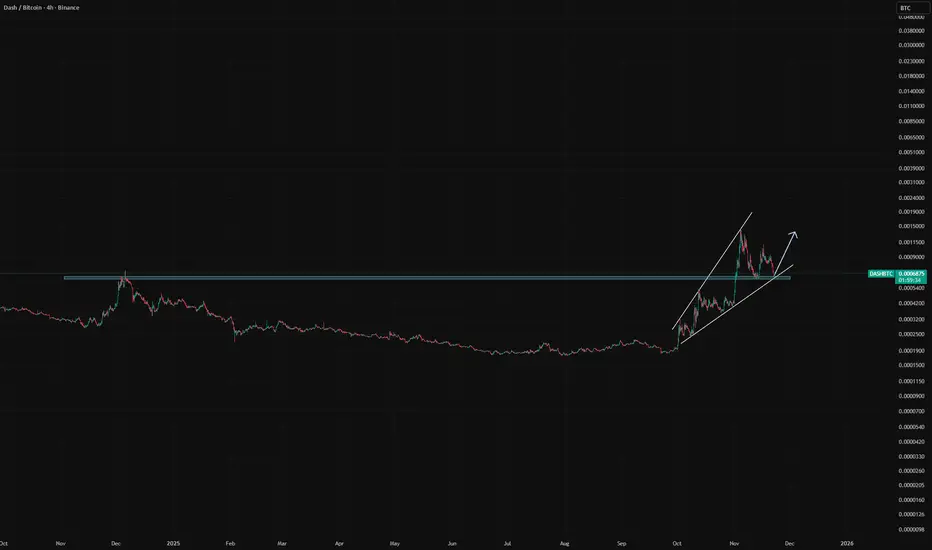
$DASHBTC and $DASHUSD to move higherWhile dash's price has moved swiftly down its btc pair found a bounce off the trendline and its turning 0.0006400 level as support if we hold here a stronger bounce for dashusd is likely to be seen in the coming days, overall crypto fear and greed index is at a 10 insanely low levels I believe this may be a good place to position yourself for dash ($55-58) as long as the level holds on dashbtc
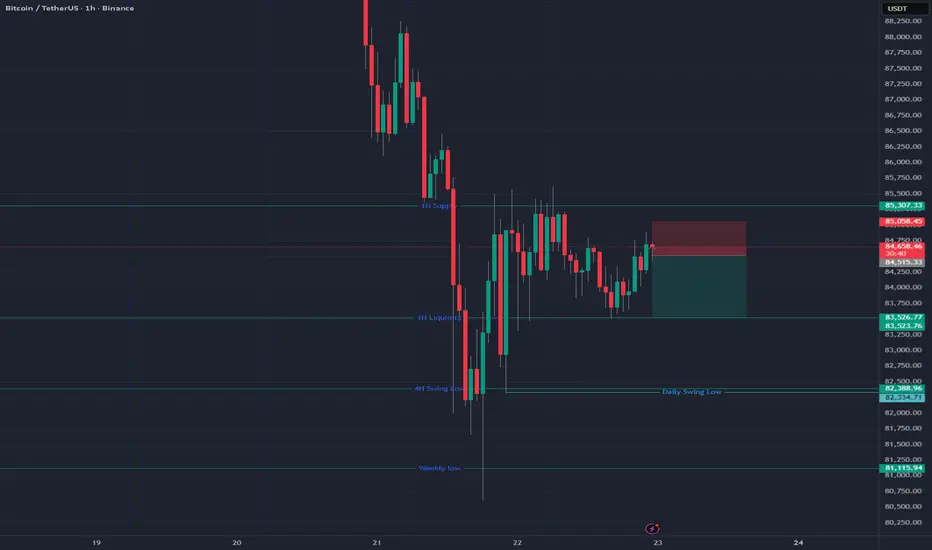
Staying with the higher-timeframe flow until proven otherwise.I’m short BTC from 84,515.33 following a clean reaction from a short-term supply zone that aligns with the broader higher-timeframe downtrend.
We had a buy-side sweep, price traded into premium, and the rejection was immediate — enough for me to take the setup.
Risk is defined above 85,058.45.
First target sits at 83,526.77, in line with the next liquidity draw.
Will continue managing this based on structure.
Support and Resistance breakdownsThis is just a simple breakdown of my guess of resistance on the way up and support on the way down for profit taking or buying opportunities respectively.
This is not financial advice, just a guess based on candle wicks and a way for me to keep track of my thoughts on the market trends at various points in time.

Rising 10_Yields Ahead?Here’s How It Could Hit BTC, Gold, StocksWhy the US 10-Year Yield Matters
The US 10-Year Treasury yield is one of the most important benchmarks in global finance. It reflects investor expectations for inflation, growth, and Federal Reserve policy. Because it influences everything from mortgage rates to equity valuations and the strength of the US dollar( TVC:DXY ), understanding its direction helps traders anticipate major market shifts.
Key Scenarios to Watch
1. Yield Rising (Bullish Yield / Bearish Bonds)
Signals stronger economic expectations or sticky inflation.
Usually pushes the USD higher and puts pressure on risk assets like tech stocks and crypto.
Markets begin pricing fewer rate cuts or even potential tightening.
2. Yield Falling (Bearish Yield / Bullish Bonds)
Indicates rising recession risk, softer inflation, or expectations of Fed rate cuts.
Supports equity markets and risk assets (including crypto).
Typically weakens the US dollar.
3. Sideways / Stable Range
Suggests economic uncertainty or balanced expectations.
Markets remain in consolidation until new macro data or Fed signals arrive.
Why Traders Follow It:
Small moves in the 10-year yield can shift global liquidity, risk sentiment, and currency flows — making it a core indicator for forecasting market direction.
Given the current data and signals, my short-term forecast is for yields to remain flat or move slightly higher, but the likelihood of a significant decline in the near term seems slim.
-----------------------------------------------------
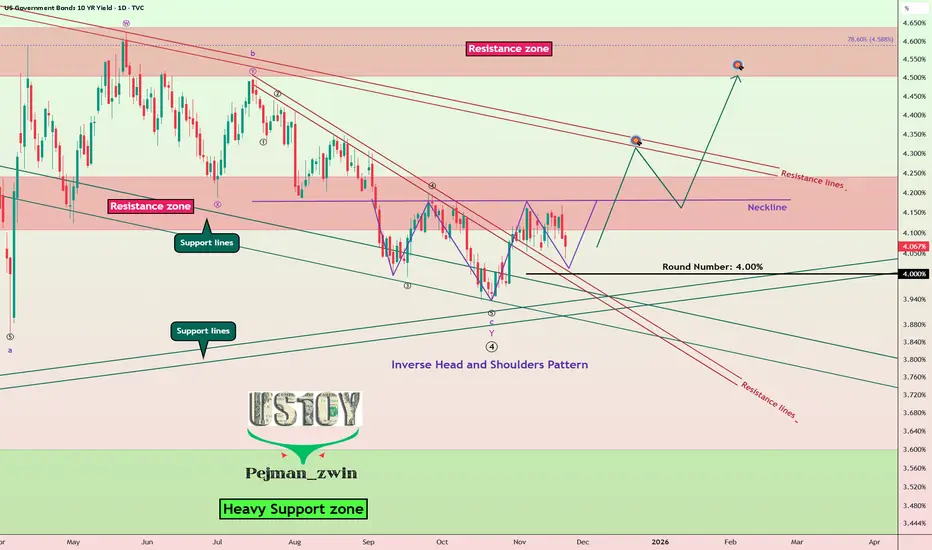
Now let's take a look at the US 10-Year Government Bond Yield chart on the daily time frame.
The US 10-Year Government Bond Yield is currently moving near the support lines and the 4.00% (Round Number).
In terms of classic technical analysis, we can expect that the US 10-Year Government Bond Yield's uptrend could start with an Inverse Head and Shoulders Pattern.
In terms of Elliott Wave theory, it appears that the US 10-Year Government Bond Yield has succeeded in completing the main wave 4 with a Double Three Correction(WXY).
I expect the US 10-Year Government Bond Yield to attack Resistance lines after breaking the Neckline and Resistance zone(4.24%-4.14%).
-----------------------------------------------------
Impact of a Rising US 10-Year Yield
•Bitcoin( BINANCE:BTCUSDT ):
A higher 10-year yield usually reduces liquidity and increases funding costs, which puts pressure on risk assets. BTC typically faces short-term downside or slower momentum when yields rise.
•Gold( OANDA:XAUUSD ):
Gold often moves inversely to yields. Rising yields increase the opportunity cost of holding gold, making it less attractive. This usually leads to weakness or consolidation in gold.
•Stocks (Equities):
Higher yields tighten financial conditions and lower valuations, especially for tech and growth stocks. Equities generally face selling pressure when yields rise sharply.
If you would like to see technical analysis on the weekly timeframe, I recommend you take a look at the link below.👇
-----------------------------------------------------
💡 Please respect each other's opinions and express agreement or disagreement politely.
📌US 10-Year Government Bond Yield Analyze ( TVC:US10 ), Daily time frame.
🛑 Always set a Stop Loss(SL) for every position you open.
✅ This is just my idea; I’d love to see your thoughts too!
🔥 If you find it helpful, please BOOST this post and share it with your friends.
Spy"You'll never earn if you never learn"
I'll cover
TVC:NYA
AMEX:IWM
NASDAQ:QQQ
And some tech Sectors
First off Spy..
I think Next week going into low vol short week we will have a slight pump.
My upside target is the 50sma at 569
Or trendline resistance so that will put us between 569-572
From there we will either break out and end the correction or head lower .
We will need to close above 675 to confirm breakout.
Any breakout over 675 and we head back to ATH minimum , this is the measured move of a broadening wedge
Will need to close below 650 and the next target is 635
NASDAQ:QQQ
Same structure as AMEX:SPY
Upside target next week is 605-608
50sma
Bearish below 580, if Qqq breaks below 580 then 550 will come next .
AMEX:IWM
Same broadening wedge as qqq and Spy
Upside target next week is 239.00
Over 239 and 244 can come..
As you can see the price action at 239 is stiff and at 244 you have 20/50ma.
Iwm has lead this sell off so if they can overcome 244 I'll have to lean more bullish towards overall market.
If iwm breaks below 228 then 224 gap close will come next .
TVC:NYA
Nyse which covers 3000 stocks..
Bounce off the bottom of a 3month range and weekly 20sma..
Cyclical stocks like banks usually move in sync with NYA as you can see with this comparison
I think Next week we could have a bounce back up to the 20/50ma next week and from there we'll see
Lastly
TVC:VIX
As long as vix holds above 19.00 the market could rug on any bounce. But looking here at their weekly chart with Bollingerbands and you can see that the vix usually dumps the following week after closing outside its weekly bbands. Added to that is they are also extended outside daily bbands
This gives me more confidence in a market bounce next week.

CAD/JPY – Wedge Breakout Pattern (21.11.2025)📝 Setup Overview OANDA:CADJPY
CAD/JPY has broken below a rising wedge structure, signaling weakening bullish momentum. After multiple rejections at the resistance zone, price is now losing steam below the Ichimoku cloud, showing early bearish pressure.A clean breakout + retest scenario opens the door for downside continuation toward the next demand zones.
📌 Trading Plan📍 Entry Idea:
Look for bearish continuation below the wedge support + cloud rejection.
🎯 Targets (Support Levels):
1st Support: 111.022
2nd Support: 110.561
🛑 Resistance Zone:
112.014 – 112.294
This zone continues to act as a strong supply area where sellers took control repeatedly.
📉 Today’s Fundamentals – Bearish CAD Bias
1️⃣ Crude Oil Pullback → Weakens CAD
Canada’s economy is heavily tied to oil prices. Today’s dip in crude oil puts pressure on the CAD, giving JPY an advantage.
2️⃣ Safe-Haven Demand Supports JPY
With global markets showing risk-off sentiment (concerns over slowing global growth + uncertain central bank guidance), investors favor safe-haven currencies like the Japanese Yen.
3️⃣ BoC Policy Tone Still Cautious
Recent Bank of Canada communications show limited confidence in economic momentum.
Markets expect slower growth → bearish CAD outlook.
➡️ Combination of oil weakness + JPY strength + wedge breakdown = bearish continuation setup.
🔖 Hashtags
#CADJPY #ForexAnalysis #PriceAction #WedgeBreakout #Ichimoku #FXTrading #TechnicalAnalysis #FundamentalAnalysis #SmartMoney #TradingViewCommunity #Kabhi_TA_Trading
⚠️ Disclaimer
This analysis is for educational purposes only.
Not financial advice. Always manage your risk and trade based on your plan.
💬 Support the Work
If you found this analysis helpful, please LIKE & COMMENT on the post ❤️
Your support motivates more high-quality setups daily!

The beginning of Bitcoin’s next drop could coincide with end QTveryone thinks the market pumps after QT policies end…
But look at early July — first the market dropped sharply. The same thing could get triggered in December and repeat the previous pattern.

PEPEUSDT is near major weekly support also trendline retest herePEPEUSDT appears to be concluding its bearish phase, with price action having breached a significant daily support level. The asset is now undergoing a critical retest of the broken trendline a common technical phenomenon where former Resistance(Red trendline) transforms into support . A successful rejection from this level could catalyze a robust bullish reversal. Based on the magnitude of the preceding decline and the strength of this support zone, we project a potential upward movement with an estimated appreciation target of 200% upon confirmed breakout confirmation.
DISCLAIMER: ((trade based on your own decision))
<<press like👍 if you enjoy💚

LAST WEEK +7RR. CHECK LAST WEEK POSTS. BIG WINS! this week we.. FOLLOW FOR MORE BITCOIN SIGNALS
last week all trades made money, all targets hit. I have a strong CRYPTO accuracy.
this week: bitcoin to continue downwards. looking for some retracement or range bound for a week. but I expect price to target 75K as its a big liquidity zone!
alternatively, price to continue shooting down like hell. either way 75K is a clear target
